Economic Status
Economic description, land use, agriculture, tourism, and industry
4.1 Major Economic Description
The foundations of economic prosperity are the main economic activities taking place in the sub-metropolitan city. The more intense the economic activities become, the more dynamic and robust the sub-metropolitan city's economy becomes. Mainly, the Nepali economy is centered around agriculture, tourism, small and cottage industries, foreign employment, banking, trade, service sector, etc. In the absence of the development of high-tech based international level industries, most of the economic activities remain subsistence-oriented.
4.1.1 Population by Economic Work and Industrial Sector
| Sector of Economic Work or Industry | Duration of Work | |||
|---|---|---|---|---|
| 6 Months or More | 3 to 5 Months | 1 to 2 Months | Total | |
| Agriculture, Forestry and Animal Husbandry | 8,246 | 3,578 | 3,463 | 15,287 |
| Mining and Quarrying | 116 | 11 | 4 | 131 |
| Industrial Manufacturing | 3,969 | 179 | 43 | 4,191 |
| Electricity, Gas, Steam and Air Conditioning Supply | 329 | 13 | 2 | 344 |
| Water Supply, Sewerage, Waste Management | 329 | 14 | 13 | 356 |
| Construction | 6,129 | 1,795 | 1,929 | 9,853 |
| Wholesale and Retail Trade | 10,010 | 3,180 | 4,174 | 17,364 |
| Transportation and Storage | 3,335 | 78 | 18 | 3,431 |
| Accommodation and Food Service Activities | 2,131 | 75 | 22 | 2,228 |
| Information and Communication | 375 | 6 | 8 | 389 |
| Real Estate Activities | 1,323 | 13 | 7 | 1,343 |
| Veterinary and Animal Health Activities | 183 | 3 | 1 | 187 |
| Professional, Scientific and Technical Activities | 622 | 14 | 4 | 640 |
| Administrative and Support Service Activities | 243 | 8 | 1 | 252 |
| Public Administration and Defense Activities | 1,704 | 16 | 7 | 1,727 |
| Education Activities | 2,571 | 44 | 15 | 2,630 |
| Human Health and Social Work Activities | 1,743 | 25 | 10 | 1,778 |
| Arts, Entertainment and Recreation | 310 | 9 | 7 | 326 |
| Other | 1,135 | 1,501 | 1,844 | 4,480 |
| Household Domestic Activities | 1,051 | 336 | 185 | 1,572 |
| Activities of Extraterritorial Organizations and Bodies | 178 | 2 | 1 | 181 |
| Not Stated | 67 | 14 | 1 | 82 |
| Total | 46,099 | 10,914 | 11,759 | 68,772 |
Out of the total population aged 10 years and above in the sub-metropolitan city, 68,772 people are engaged in some kind of economic activity and earning income. Among them, the highest number, 17,364 people, are engaged in wholesale and retail trade activities. Similarly, there are 15,287 people engaged in agriculture, forestry, and animal husbandry. Furthermore, the number of people engaged in activities earning income for more than 6 months is 46,099, those engaged in economic activities for only 1 to 2 months is 11,759, and those engaged in economic activities for only 3 to 5 months is 10,914. Detailed descriptions of this are presented in the table.
4.1.2 Housing Structure Description
A) Description of Households Based on Home Ownership
In this sub-metropolitan city, 4 types of housing structures are found to be used based on home ownership. 26,860 households, or 77.71 percent, reside in privately owned homes. Similarly, the number of those living in rented accommodations is 7,130, or 20.63 percent. 394 families, or 1.14 percent, live in institutional houses, while 181 households, or 0.52 percent, live in houses with an unspecified ownership status. Since Nepal is sensitive from a seismic point of view, it is necessary to make houses earthquake-resistant when constructing them. If the government ensures the right to housing security for extremely poor families by building integrated settlements, the welfare role of the state is affirmed.
| Ward No. | Private | Rented | Institutional | Other (To be specified) | Total |
|---|---|---|---|---|---|
| 1 | 1,481 | 673 | 6 | 7 | 2,167 |
| 2 | 825 | 508 | 14 | 16 | 1,363 |
| 3 | 511 | 37 | 6 | 2 | 556 |
| 4 | 1,736 | 1,136 | 20 | 26 | 2,918 |
| 5 | 933 | 195 | 4 | 5 | 1,137 |
| 6 | 1,090 | 309 | 10 | 2 | 1,411 |
| 7 | 542 | 125 | 6 | 9 | 682 |
| 8 | 733 | 111 | 6 | 2 | 852 |
| 9 | 831 | 552 | 27 | 15 | 1,425 |
| 10 | 1,401 | 1,102 | 151 | 9 | 2,663 |
| 11 | 851 | 141 | 3 | 6 | 1,001 |
| 12 | 1,228 | 474 | 27 | 9 | 1,738 |
| 13 | 1,238 | 185 | 40 | 3 | 1,466 |
| 14 | 995 | 56 | 2 | 3 | 1,056 |
| 15 | 1,057 | 62 | 1 | 25 | 1,145 |
| 16 | 1,045 | 47 | 3 | 5 | 1,100 |
| 17 | 1,156 | 63 | 1 | 0 | 1,220 |
| 18 | 2,207 | 467 | 25 | 3 | 2,702 |
| 19 | 1,531 | 169 | 6 | 5 | 1,711 |
| 20 | 2,654 | 598 | 29 | 17 | 3,298 |
| 21 | 1,523 | 26 | 2 | 2 | 1,553 |
| 22 | 966 | 94 | 1 | 5 | 1,066 |
| 23 | 326 | 0 | 4 | 5 | 335 |
| Total | 26,860 | 7,130 | 394 | 181 | 34,565 |
| Percentage | 77.71 | 20.63 | 1.14 | 0.52 | 100 |
Household Details by Home Ownership
Household Details by Home Ownership
Tap bars or slices to view details
B) Number of Households Based on Women's Ownership of House and Land
| Women's Ownership | House Only | Land Only | Both | Neither | Not Specified | Total |
|---|---|---|---|---|---|---|
| Total | 1,389 | 2,838 | 5,017 | 24,303 | 1,018 | 34,565 |
| Percentage | 4.02 | 8.21 | 14.51 | 70.31 | 2.95 | 100 |
Population By Women's Ownership
Population By Women's Ownership
Tap bars or slices to view details
C) Living Conditions of Children Under 18 Years of Age
| Age Group | Mother & Father | Mother Only | Father Only | Father & Stepmom | Mother & Stepdad | Other Relatives | Employer | Other | Not Specified | Total |
|---|---|---|---|---|---|---|---|---|---|---|
| Under 1 yr | 2,376 | 118 | 3 | 2 | 0 | 10 | 0 | 0 | 1 | 2,510 |
| 1-4 yrs | 10,521 | 822 | 48 | 15 | 2 | 71 | 0 | 1 | 4 | 11,484 |
| 5-9 yrs | 14,914 | 1,343 | 121 | 29 | 7 | 268 | 0 | 1 | 10 | 16,693 |
| 10-14 yrs | 14,479 | 1,539 | 168 | 51 | 10 | 518 | 10 | 22 | 16 | 16,813 |
| 15-17 yrs | 8,214 | 961 | 167 | 39 | 5 | 666 | 12 | 85 | 38 | 10,187 |
| Total | 50,504 | 4,783 | 507 | 136 | 24 | 1,533 | 22 | 109 | 69 | 57,687 |
| Percentage | 87.55 | 8.29 | 0.88 | 0.24 | 0.04 | 2.66 | 0.04 | 0.19 | 0.12 | 100 |
Living Arrangement Of Children Under 18 Years
Living Arrangement Of Children Under 18 Years
Tap bars or slices to view details
Out of the total population of children under 18 years of age in the sub-metropolitan city, 50,504, or 87.55 percent, live with their mother and father, while 4,783, or 8.29 percent, live only with their mother, and 507, or 0.88 percent, live only with their father. Additionally, 1,533, or 2.66 percent, of the children live with other relatives, 136, or 0.24 percent, live with their father and stepmother, and 24, or 0.04 percent, live with their mother and stepfather. The detailed description of this is presented in the table above.
D) Details of Households Based on Foundation
| Ward No. | Mud Bonded Bricks/Stones | Cement Bonded Bricks/Stones | RCC Pillars | Wooden Pillars | Other | Total |
|---|---|---|---|---|---|---|
| 1 | 169 | 1,122 | 861 | 7 | 0 | 2,167 |
| 2 | 80 | 339 | 928 | 11 | 5 | 1,363 |
| 3 | 66 | 434 | 54 | 1 | 1 | 556 |
| 4 | 352 | 1,177 | 1,423 | 13 | 23 | 2,918 |
| 5 | 209 | 674 | 252 | 2 | 0 | 1,137 |
| 6 | 207 | 516 | 684 | 4 | 0 | 1,411 |
| 7 | 58 | 434 | 188 | 1 | 1 | 682 |
| 8 | 76 | 704 | 70 | 2 | 0 | 852 |
| 9 | 168 | 739 | 508 | 9 | 1 | 1,425 |
| 10 | 302 | 1,506 | 850 | 2 | 3 | 2,663 |
| 11 | 135 | 696 | 168 | 2 | 0 | 1,001 |
| 12 | 143 | 660 | 930 | 4 | 1 | 1,738 |
| 13 | 548 | 826 | 89 | 3 | 0 | 1,466 |
| 14 | 487 | 278 | 170 | 7 | 114 | 1,056 |
| 15 | 610 | 385 | 87 | 32 | 31 | 1,145 |
| 16 | 371 | 499 | 225 | 4 | 1 | 1,100 |
| 17 | 373 | 727 | 49 | 1 | 0 | 1,220 |
| 18 | 276 | 1,606 | 805 | 12 | 3 | 2,702 |
| 19 | 506 | 768 | 430 | 4 | 3 | 1,711 |
| 20 | 1,036 | 1,559 | 606 | 73 | 24 | 3,298 |
| 21 | 638 | 774 | 98 | 34 | 9 | 1,553 |
| 22 | 368 | 401 | 224 | 3 | 70 | 1,066 |
| 23 | 69 | 91 | 47 | 6 | 122 | 335 |
| Total | 7,247 | 16,915 | 9,754 | 237 | 412 | 34,565 |
| Percentage | 20.97 | 48.94 | 28.22 | 0.69 | 1.19 | 100 |
Household Details Based on Foundation
Household Details Based on Foundation
Tap bars or slices to view details
E) Details of Households Based on Outer Wall
| Ward No. | Mud bonded bricks/stones | Cement bonded bricks/stones | Wood | Bamboo | Unbaked Bricks | Galvanized Sheet | Prefabricated Sheet | Other | Total |
|---|---|---|---|---|---|---|---|---|---|
| 1 | 157 | 1,992 | 5 | 0 | 6 | 7 | 0 | 0 | 2,167 |
| 2 | 53 | 1,284 | 5 | 7 | 0 | 14 | 0 | 0 | 1,363 |
| 3 | 66 | 485 | 0 | 3 | 0 | 2 | 0 | 0 | 556 |
| 4 | 314 | 2,564 | 5 | 1 | 0 | 12 | 0 | 22 | 2,918 |
| 5 | 195 | 937 | 2 | 0 | 0 | 2 | 0 | 1 | 1,137 |
| 6 | 193 | 1,206 | 6 | 0 | 0 | 1 | 0 | 5 | 1,411 |
| 7 | 37 | 642 | 1 | 0 | 0 | 2 | 0 | 0 | 682 |
| 8 | 74 | 773 | 3 | 1 | 1 | 0 | 0 | 0 | 852 |
| 9 | 186 | 1,226 | 1 | 0 | 9 | 3 | 0 | 0 | 1,425 |
| 10 | 138 | 2,508 | 11 | 0 | 0 | 3 | 0 | 3 | 2,663 |
| 11 | 111 | 879 | 2 | 1 | 0 | 0 | 0 | 0 | 1,001 |
| 12 | 139 | 1,579 | 7 | 3 | 2 | 2 | 0 | 6 | 1,738 |
| 13 | 505 | 944 | 9 | 1 | 4 | 2 | 1 | 0 | 1,466 |
| 14 | 430 | 498 | 2 | 7 | 66 | 3 | 0 | 50 | 1,056 |
| 15 | 464 | 565 | 4 | 35 | 62 | 1 | 0 | 14 | 1,145 |
| 16 | 328 | 759 | 8 | 1 | 1 | 2 | 0 | 1 | 1,100 |
| 17 | 366 | 830 | 1 | 0 | 1 | 3 | 0 | 19 | 1,220 |
| 18 | 261 | 2,416 | 5 | 9 | 3 | 6 | 0 | 2 | 2,702 |
| 19 | 413 | 1,208 | 1 | 3 | 2 | 0 | 0 | 4 | 1,711 |
| 20 | 941 | 2,251 | 26 | 19 | 6 | 3 | 0 | 52 | 3,298 |
| 21 | 660 | 844 | 25 | 8 | 1 | 2 | 0 | 5 | 1,553 |
| 22 | 360 | 617 | 2 | 4 | 1 | 0 | 0 | 82 | 1,066 |
| 23 | 64 | 142 | 8 | 1 | 1 | 0 | 0 | 119 | 335 |
| Total | 6,543 | 27,149 | 139 | 104 | 174 | 70 | 1 | 385 | 34,565 |
| Percentage | 18.93 | 78.54 | 0.40 | 0.30 | 0.50 | 0.20 | 0.00 | 1.11 | 100 |
Households By Outer Wall Details
Households By Outer Wall Details
Tap bars or slices to view details
F) Details of Households Based on Floor
In this sub-metropolitan city, 6 types of housing structures can be found based on floor ownership. 22,416 households, or 64.85 percent, are using cement concrete floors. Similarly, the number of households using mud floors is 8,706, or 25.19 percent, 666 households or 1.93 percent use bricks/stones, 1,787 households or 5.17 percent use ceramic tiles, 841 households or 2.43 percent use wooden planks/bamboo, and 149 households or 0.43 percent have an unspecified status. Due to Nepal's high seismic sensitivity, it is essential to construct earthquake-resistant houses. If the government can ensure housing security for ultra-poor families by building integrated settlements, it will affirm the state's welfare role. The detailed description is presented in the table below.
| Ward No. | Mud | Wooden Planks/Bamboo | Bricks/Stones | Ceramic Tile | Cement Concrete | Other | Total |
|---|---|---|---|---|---|---|---|
| 1 | 127 | 48 | 67 | 172 | 1,745 | 8 | 2,167 |
| 2 | 78 | 14 | 26 | 85 | 1,158 | 2 | 1,363 |
| 3 | 48 | 28 | 12 | 9 | 454 | 5 | 556 |
| 4 | 158 | 112 | 25 | 209 | 2,392 | 22 | 2,918 |
| 5 | 122 | 29 | 51 | 33 | 899 | 3 | 1,137 |
| 6 | 216 | 13 | 194 | 71 | 914 | 3 | 1,411 |
| 7 | 44 | 17 | 6 | 40 | 571 | 4 | 682 |
| 8 | 69 | 17 | 6 | 31 | 729 | 0 | 852 |
| 9 | 157 | 24 | 19 | 41 | 1,172 | 12 | 1,425 |
| 10 | 126 | 52 | 20 | 359 | 2,095 | 11 | 2,663 |
| 11 | 96 | 40 | 18 | 66 | 778 | 3 | 1,001 |
| 12 | 140 | 35 | 20 | 172 | 1,370 | 1 | 1,738 |
| 13 | 708 | 46 | 20 | 9 | 680 | 3 | 1,466 |
| 14 | 748 | 16 | 3 | 9 | 276 | 4 | 1,056 |
| 15 | 702 | 12 | 5 | 8 | 404 | 14 | 1,145 |
| 16 | 493 | 16 | 34 | 3 | 548 | 6 | 1,100 |
| 17 | 514 | 99 | 16 | 47 | 544 | 0 | 1,220 |
| 18 | 302 | 54 | 28 | 225 | 2,085 | 8 | 2,702 |
| 19 | 640 | 23 | 21 | 45 | 974 | 8 | 1,711 |
| 20 | 1,208 | 112 | 28 | 126 | 1,814 | 10 | 3,298 |
| 21 | 1,073 | 22 | 11 | 5 | 439 | 3 | 1,553 |
| 22 | 655 | 12 | 36 | 15 | 329 | 19 | 1,066 |
| 23 | 282 | 0 | 0 | 7 | 46 | 0 | 335 |
| Total | 8,706 | 841 | 666 | 1,787 | 22,416 | 149 | 34,565 |
| Percentage | 25.19 | 2.43 | 1.93 | 5.17 | 64.85 | 0.43 | 100 |
Details of Households Based on Floor
Details of Households Based on Floor
Tap bars or slices to view details
G) Details of Households Based on Roof
| Ward No. | Galvanized/Tin | Cement Concrete | Thatch/Straw | Tile/Roofing | Stone/Slate | Wood/Planks | Other | Total |
|---|---|---|---|---|---|---|---|---|
| 1 | 157 | 1,140 | 9 | 10 | 48 | 3 | 0 | 2,167 |
| 2 | 119 | 1,208 | 4 | 10 | 17 | 3 | 2 | 1,363 |
| 3 | 71 | 475 | 2 | 3 | 4 | 1 | 0 | 556 |
| 4 | 232 | 2,624 | 5 | 4 | 14 | 17 | 22 | 2,918 |
| 5 | 170 | 954 | 2 | 8 | 2 | 1 | 0 | 1,137 |
| 6 | 218 | 1,126 | 14 | 44 | 5 | 1 | 3 | 1,411 |
| 7 | 59 | 602 | 3 | 9 | 2 | 7 | 0 | 682 |
| 8 | 84 | 746 | 10 | 1 | 8 | 2 | 1 | 852 |
| 9 | 92 | 1,253 | 11 | 65 | 2 | 2 | 0 | 1,425 |
| 10 | 127 | 2,496 | 14 | 11 | 5 | 6 | 4 | 2,663 |
| 11 | 121 | 851 | 9 | 0 | 9 | 11 | 0 | 1,001 |
| 12 | 174 | 1,532 | 6 | 19 | 6 | 0 | 1 | 1,738 |
| 13 | 460 | 885 | 32 | 83 | 3 | 3 | 0 | 1,466 |
| 14 | 396 | 475 | 62 | 120 | 2 | 0 | 1 | 1,056 |
| 15 | 349 | 527 | 85 | 175 | 4 | 2 | 3 | 1,145 |
| 16 | 324 | 712 | 16 | 31 | 4 | 13 | 0 | 1,100 |
| 17 | 322 | 809 | 12 | 75 | 1 | 1 | 0 | 1,220 |
| 18 | 326 | 2,319 | 14 | 33 | 8 | 2 | 0 | 2,702 |
| 19 | 551 | 1,091 | 21 | 39 | 3 | 0 | 6 | 1,711 |
| 20 | 1,154 | 1,966 | 49 | 110 | 16 | 1 | 2 | 3,298 |
| 21 | 622 | 768 | 38 | 118 | 6 | 0 | 1 | 1,553 |
| 22 | 393 | 559 | 59 | 43 | 7 | 1 | 4 | 1,066 |
| 23 | 155 | 98 | 55 | 26 | 0 | 0 | 1 | 335 |
| Total | 6,676 | 26,016 | 532 | 1,037 | 176 | 77 | 51 | 34,565 |
| Percentage | 19.31 | 75.27 | 1.54 | 3.00 | 0.51 | 0.22 | 0.15 | 100 |
Details of Households Based on Roof
Details of Households Based on Roof
Tap bars or slices to view details
4.1.3 Import Export Status
For any sub-metropolitan city to be economically strong, it is mandatory that exports exceed imports. When the volume of exports is greater than imports, it increases trade profit and helps elevate the economic standard. Only by promoting the products produced within the sub-metropolitan city, becoming self-reliant in local products, and increasing exports can the economic status of the sub-metropolitan city grow. From the sub-metropolitan city, agricultural products such as paddy, rice, lentils, vegetables, fish and meat, as well as animal products like goats, pigs, boars, and chickens are exported to other neighboring local levels and places. On the other hand, additional food items, clothes, household electrical appliances, construction materials, educational materials, chemical fertilizers, fruits, health medicines, and equipment are imported. Since imports exceed exports, the trade deficit of the sub-metropolitan city can be clearly estimated. However, for exact statistics, the sub-metropolitan city needs to take a special initiative.
4.1.4 Industrial Raw Material Production
Although Nepal is rich in terms of the abundance of raw materials based on local resources, the reality before us is that it lags far behind in their sustainable utilization. The resources available to us include herbs, fruits, food grains, vegetables, etc. The commercial production and sustainable utilization of such raw materials will directly and positively contribute to the economy of the sub-metropolitan city. In addition, substantial benefits can also be derived from commercial animal husbandry.
4.1.5 Foreign Employment Description
From this municipality, the number of people going for foreign employment to various countries is 3,804. Analyzing by age group, the highest number, 1,642 people, from the 15-24 age group have gone for foreign employment, whereas the lowest number, 10 people, from the above 65 years age group have gone. Among those who have gone for foreign employment, the highest number is of those going to Middle Eastern countries.
| Age Group | Gender | Name of Country | Total | ||||||||||||
|---|---|---|---|---|---|---|---|---|---|---|---|---|---|---|---|
| India | SAARC | Middle East Asia | Other Asian | Europe | Other Europe | North America | South America | Africa | Pacific | Other | Unspecified | ||||
| 0-14 Years | Male | 63 | 0 | 1 | 13 | 4 | 4 | 3 | 20 | 0 | 0 | 10 | 0 | 0 | 118 |
| Female | 23 | 0 | 3 | 0 | 3 | 1 | 8 | 9 | 0 | 0 | 2 | 0 | 4 | 53 | |
| Total | 86 | 0 | 4 | 13 | 7 | 5 | 11 | 29 | 0 | 0 | 12 | 0 | 4 | 171 | |
| 15-24 Years | Male | 435 | 5 | 202 | 451 | 42 | 27 | 24 | 76 | 0 | 4 | 73 | 5 | 3 | 1,347 |
| Female | 96 | 2 | 5 | 25 | 21 | 22 | 15 | 52 | 1 | 4 | 49 | 1 | 2 | 295 | |
| Total | 531 | 7 | 207 | 476 | 63 | 49 | 39 | 128 | 1 | 8 | 122 | 6 | 5 | 1,642 | |
| 25-34 Years | Male | 157 | 4 | 126 | 533 | 51 | 53 | 11 | 67 | 0 | 12 | 56 | 3 | 5 | 1,078 |
| Female | 55 | 0 | 4 | 36 | 17 | 12 | 7 | 31 | 0 | 1 | 39 | 0 | 1 | 203 | |
| Total | 212 | 4 | 130 | 569 | 68 | 65 | 18 | 98 | 0 | 13 | 95 | 3 | 6 | 1,281 | |
| 35-44 Years | Male | 101 | 2 | 76 | 235 | 16 | 9 | 2 | 13 | 0 | 7 | 4 | 0 | 5 | 470 |
| Female | 18 | 0 | 2 | 16 | 1 | 0 | 0 | 5 | 0 | 0 | 0 | 0 | 0 | 42 | |
| Total | 119 | 2 | 78 | 251 | 17 | 9 | 2 | 18 | 0 | 7 | 4 | 0 | 5 | 512 | |
| 45-54 Years | Male | 35 | 0 | 4 | 33 | 1 | 0 | 0 | 3 | 0 | 2 | 0 | 0 | 0 | 78 |
| Female | 4 | 0 | 0 | 6 | 1 | 0 | 0 | 2 | 0 | 0 | 0 | 0 | 0 | 13 | |
| Total | 39 | 0 | 4 | 39 | 2 | 0 | 0 | 5 | 0 | 2 | 0 | 0 | 0 | 91 | |
| 55-64 Years | Male | 10 | 0 | 2 | 4 | 0 | 0 | 0 | 2 | 0 | 0 | 2 | 0 | 0 | 20 |
| Female | 2 | 0 | 0 | 0 | 0 | 1 | 0 | 1 | 0 | 0 | 0 | 0 | 0 | 4 | |
| Total | 12 | 0 | 2 | 4 | 0 | 1 | 0 | 3 | 0 | 0 | 2 | 0 | 0 | 24 | |
| Above 65 Years | Male | 3 | 0 | 0 | 1 | 2 | 0 | 0 | 0 | 0 | 0 | 0 | 0 | 0 | 6 |
| Female | 1 | 0 | 0 | 0 | 1 | 0 | 0 | 2 | 0 | 0 | 0 | 0 | 0 | 4 | |
| Total | 4 | 0 | 0 | 1 | 3 | 0 | 0 | 2 | 0 | 0 | 0 | 0 | 0 | 10 | |
| Unspecified | Male | 12 | 0 | 4 | 13 | 5 | 4 | 1 | 8 | 0 | 1 | 4 | 0 | 5 | 57 |
| Female | 5 | 0 | 2 | 1 | 0 | 1 | 1 | 2 | 0 | 0 | 4 | 0 | 0 | 16 | |
| Total | 17 | 0 | 6 | 14 | 5 | 5 | 2 | 10 | 0 | 1 | 8 | 0 | 5 | 73 | |
| Total | Male | 816 | 11 | 415 | 1,283 | 121 | 97 | 41 | 189 | 0 | 26 | 149 | 8 | 18 | 3,174 |
| Female | 204 | 2 | 16 | 84 | 44 | 37 | 31 | 104 | 1 | 5 | 94 | 1 | 7 | 630 | |
| Total | 1,020 | 13 | 431 | 1,367 | 165 | 134 | 72 | 293 | 1 | 31 | 243 | 9 | 25 | 3,804 | |
4.1.6 Sukumbasi Related Description
In Nepal, the issue of family land ownership is linked to economic status. Since Nepal's economy is based on agriculture, it is natural to link land ownership with economic status, but recently, with the increase in people's access to foreign employment and other service sectors, the trend of building one's economic status from non-agricultural sectors has started. On the other hand, land ownership is also viewed as one's birthplace or place of residence. In this sense, every citizen's land ownership has been viewed as a major economic, social, and political issue since centuries. Similarly, the distribution of land in Nepal is unscientific.
4.2 Land Use and Ownership
4.2.1 Land Use Distribution
Land is an important natural resource. It should be properly used for economic development. Land is used for management of agriculture, housing, roads, drinking water, irrigation, electricity and energy, information and communication, etc. In this section, a factual depiction of the land use and land cover of the sub-metropolitan city has been provided.
Looking at the current land use of this sub-metropolitan city, 80.14 percent, i.e., the largest area, is occupied by the agricultural sector, followed by settlements in the second position. Among the available land, the portion of cultivable land is good. There seems to be a good possibility of production if scientific agricultural systems can be adopted in all the cultivable land. Another notable aspect of land use in this city is the area covered by its agriculture. It is positive for the city dwellers that 80.14 percent of the total land area remains cultivable. Detailed descriptions of other land uses are mentioned in the table below:-
| Land Use Category | Sub-Metropolitan City Land Use Description Area (Sq. Km.) | Area in Percentage |
|---|---|---|
| Agriculture | 68.87 | 80.14 |
| Public Use Area | 2.97 | 3.45 |
| Religious Area | 0.02 | 0.03 |
| Shrub/Bushes Area | 2.25 | 2.61 |
| Water Area | 0.74 | 0.86 |
| Industrial Area | 0.89 | 1.03 |
| Public Place | 2.97 | 3.45 |
| Residential Area | 6.96 | 8.10 |
| Other Area | 0.28 | 0.33 |
| Total | 85.94 | 100 |
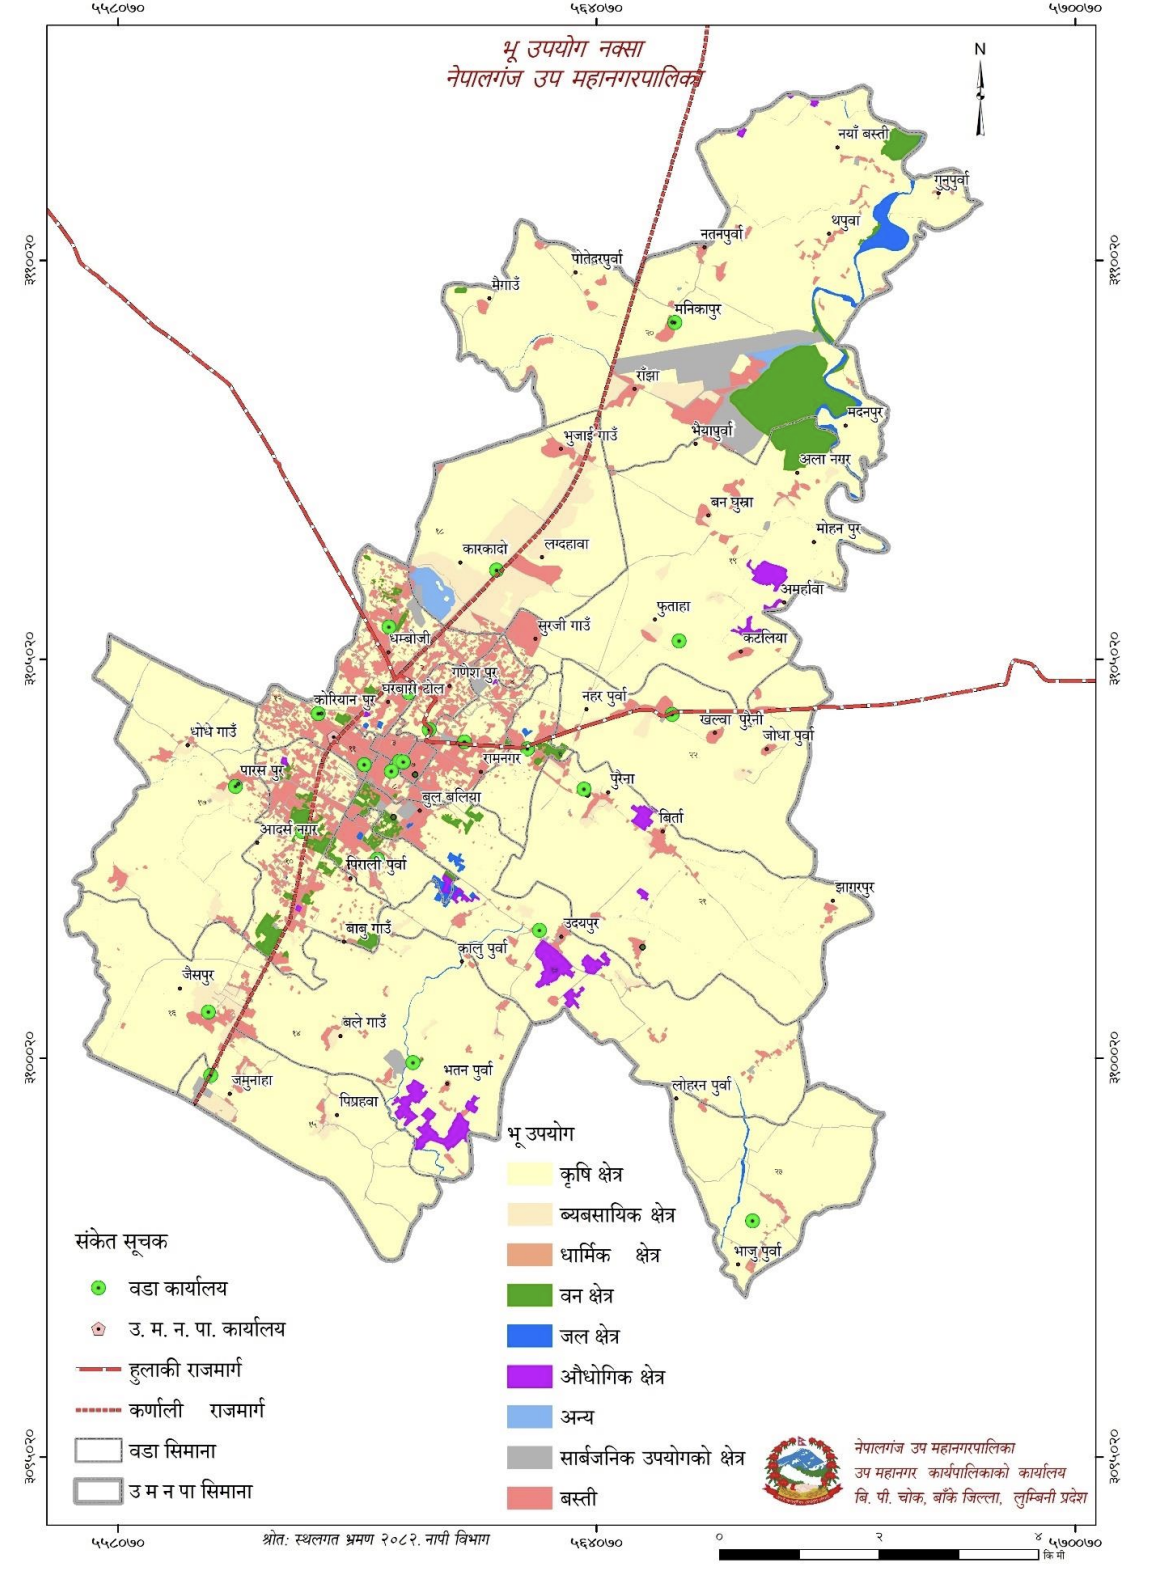
Map No. 4: Land Use Map of the Sub-Metropolitan City
4.2.2 Cultivable Land Description
Without scientific and professional land use, the agricultural sector is facing heavy losses. It is observed that not all cultivable land available in the city is being utilized scientifically and professionally. Although cultivable land is available, its lack of full utilization leads to land becoming barren on one hand, and a decrease in agricultural production leading to required imports on the other. According to data from the Land Information System, 68.87 sq. km., i.e., 80.14 percent of the land in the sub-metropolitan city, is cultivable.
Just having cultivable land is not enough; it must have irrigation facilities. To fully utilize cultivable land for farming, providing irrigation facilities is mandatory. Therefore, local levels should prepare accurate descriptions of cultivable land in their area and maintain correct data on both irrigated and non-irrigated land. Following this, it's necessary to focus priority on providing irrigation to non-irrigated land through single or alternative methods.
4.2.3 Barren Land Description
In the city, some areas contain barren land in an unused state. All types of land can be utilized in one way or another. Land itself is an invaluable natural resource. In non-farming areas, fodder or medicinal herbs can be planted, or if suitable areas are available, they can be developed into open spaces, recreation centers, parks, or gardens. In cases where farming is not possible, such land can also be utilized for housing development. In this sub-metropolitan city, non-irrigated lands are in a barren state.
4.3 Agriculture and Animal Development
History shows that agriculture has been the backbone of development for industrial nations that have achieved the highest levels of development today. The foundation of prosperity for powerful nations in Europe, America, and Asia is also based on agricultural revolutions. Therefore, given the limited alternatives to agriculture and its vast potential in our country, the first mandatory requirement before implementing other ambitious development plans is to revolutionize the agricultural sector to become self-reliant in food grains, fruits, vegetables, and overall agricultural produce, thereby increasing exports. Even in today's era of advanced technologies, remaining limited to our subsistence-oriented traditional farming system is a kind of irony. Therefore, local governments should conduct feasibility studies and revolutionize agricultural production and development through the development of all necessary agricultural infrastructures for professional and scientific farming.
4.4 Agricultural Family, Area, Parcel and Irrigated Area
In the National Census 2078, a Sample Frame was prepared for conducting the National Agriculture Census based on agricultural family details, including land and livestock information for each family. Wards or enumeration areas were selected based on that frame, and detailed information on agricultural families was collected. According to the results of the National Agriculture Census 2078, the total number of agricultural families in Nepalgunj Sub-Metropolitan City is 7,222.
The 7,222 agricultural families in this sub-metropolitan city are observed to be practicing agriculture on 4,435.5 hectares of land across 16,557 parcels. On average, an agricultural family farms on 2.3 parcels. The total irrigated area here is 3,423.5 hectares.
| Province/District/Local Level | Total Agricultural Families | Total Land Area Utilized (Hectares) | Total Number of Parcels | Average Number of Parcels | Families Using Irrigation | Irrigated Area (Hectares) |
|---|---|---|---|---|---|---|
| Lumbini Province | 75,092 | 426,614.4 | 2,252,764 | 2.9 | 548,799 | 241,944.3 |
| Banke District | 63,885 | 36,828.3 | 149,775 | 2.2 | 56,981 | 25,115.3 |
| Nepalgunj Sub-Metropolitan City | 7,222 | 4,435.5 | 16,557 | 2.3 | 6,849 | 3,423.5 |
4.5 Land Consumption Description
According to the results of the National Agriculture Census 2078, regarding land consumption in this sub-metropolitan city, the number of agricultural families farming only on family-owned land is 5,864 (81.20%), covering an area of 3,288.1 hectares (74.13%). Similarly, the number of agricultural families farming only on land owned by others under certain agreements is 146 (2.02%), covering 127.3 hectares (2.87%). There are no farmers practicing agriculture under other types of consumption in this sub-metropolitan city. Furthermore, the number of agricultural families farming on land with more than one type of ownership is 1,212 (16.78%), covering an area of 1,020 hectares (23%).
| Province/District/Local Level | Total Agricultural Families | Total Land Area Utilized (Hectares) | Single Type of Ownership | More than One Type of Ownership | ||||||
|---|---|---|---|---|---|---|---|---|---|---|
| Farming Only on Family Owned Land | Farming Only on Land Owned by Others | Farming Under Other Types of Consumption | ||||||||
| Number of Families | Area (Hectares) | Number of Families | Area (Hectares) | Number of Families | Area (Hectares) | Number of Families | Area (Hectares) | |||
| Lumbini Province | 75,092 | 426,614.4 | 633,504 | 330,352.5 | 6,722 | 3,299.5 | 2,573 | 663.5 | 122,293 | 92,299.0 |
| Banke District | 63,885 | 36,828.3 | 54,206 | 27,257.1 | 1,549 | 656.3 | 516 | 97.8 | 11,615 | 8,817.1 |
| Nepalgunj Sub-Metropolitan City | 7,222 | 4,435.5 | 5,864 | 3,288.1 | 146 | 127.3 | 0 | 0 | 1,212 | 1,020.0 |
| Province/District/Local Level | Food Crops | Pulse/Lentil Crops | Tuber Crops | Oilseed Crops | Vegetable Crops | Other Temporary Crops | ||||||
|---|---|---|---|---|---|---|---|---|---|---|---|---|
| No. of Families | Area | No. of Families | Area | No. of Families | Area | No. of Families | Area | No. of Families | Area | No. of Families | Area | |
| Lumbini Province | 729,496 | 511,178.0 | 388,616 | 44,965.4 | 400,375 | 15,057.6 | 382,429 | 57,798.5 | 363,129 | 16,587.8 | 352,086 | 17,639.0 |
| Banke District | 63,246 | 50,535.7 | 31,645 | 7,247.9 | 24,406 | 1,021.0 | 20,761 | 3,914.3 | 21,962 | 1,539.2 | 25,268 | 815.4 |
| Nepalgunj Sub-Metropolitan City | 6,636 | 7,279.3 | 2,359 | 353.5 | 847 | 35.6 | 827 | 170.3 | 2,186 | 246.6 | 1,711 | 73.3 |
| Province/District/Local Level | Paddy Crop | Wheat Crop | Maize Crop | Millet Crop | Barley Crop | Buckwheat Crop | ||||||
|---|---|---|---|---|---|---|---|---|---|---|---|---|
| No. of Families | Area | No. of Families | Area | No. of Families | Area | No. of Families | Area | No. of Families | Area | No. of Families | Area | |
| Lumbini Province | 0.25 | 248,818.8 | 495,137 | 168,826.1 | 452,282 | 77,719.0 | 64,500 | 7,305.6 | 81,533 | 7,567.2 | 8,577 | 616.1 |
| Banke District | 59,395 | 28,898.4 | 46,626 | 18,355.9 | 25,840 | 3,201.9 | 54 | 8.1 | 82 | 7.1 | 133 | 57.2 |
| Nepalgunj Sub-Metropolitan City | 6,375 | 3,189.3 | 5,885 | 3,129.7 | 1,164 | 160.2 | 0 | 0 | 0 | |||
| Province/District/Local Level | Total Agricultural Families | Total Area Utilized (Ha.) | Permanent Crops | |||||||||
|---|---|---|---|---|---|---|---|---|---|---|---|---|
| Number of Agricultural Families | Total Area of Permanent Crops (Ha.) | Planted as Orchards | Scattered Trees | |||||||||
| Productive Age | Non-productive Age | Productive Age | Non-productive Age | |||||||||
| No. of Families | Area (Ha.) | No. of Trees | No. of Families | Area (Ha.) | No. of Trees | |||||||
| Lumbini Province | 75,092 | 426,614.4 | 463,750 | 29,379.5 | 102,704 | 6,265.5 | 5,098,107 | 130,664 | 23,114.1 | 2,709,953 | 5,608,128 | 2,021,997 |
| Banke District | 63,885 | 36,828.3 | 30,321 | 398.2 | 3405 | 333.0 | 65,979 | 1,130 | 65.2 | 53,893 | 140,560 | 76,661 |
| Nepalgunj Sub-Metropolitan City | 7,222 | 4,435.5 | 1,665 | 97.0 | 615 | 91.0 | 10,314 | 63 | 6.0 | 37,907 | 2,990 | 2,421 |
| Province/ District/ Local Level | Orange | Lime | Mango | Banana | ||||||||||||
|---|---|---|---|---|---|---|---|---|---|---|---|---|---|---|---|---|
| No. of Families | Planted as Orchards | No. of Scattered Trees | No. of Families | Planted as Orchards | No. of Scattered Trees | No. of Families | Planted as Orchards | No. of Scattered Trees | No. of Families | Planted as Orchards | No. of Scattered Trees | |||||
| Area | No. of Trees | Area | No. of Trees | Area | No. of Trees | Area | No. of Trees | |||||||||
| Lumbini Province | 68,491 | 865.4 | 616,503 | 350,468 | 126,694 | 597.2 | 461,633 | 385,126 | 68,491 | 865.4 | 616,503 | 350,468 | 126,694 | 597.2 | 461,633 | 385,126 |
| Banke District | 47 | 0.0 | 0 | 47 | 7,546 | 25.2 | 6,544 | 16,583 | 24,020 | 294.8 | 48,006 | 77,368 | 5,559 | 12.5 | 6,806 | 23,744 |
| Nepalgunj Sub-Metropolitan City | 0.0 | 0 | 0 | 100 | 0.1 | 25 | 163 | 1,265 | 74.9 | 5,980 | 3,141 | 138 | 5.6 | 552 | 188 | |
| Province/ District/ Local Level | Total Number of Agricultural Families | Paddy | |||||||
|---|---|---|---|---|---|---|---|---|---|
| No. of Families | Type of Seeds | Families Using Pesticides | Use of Fertilizers | ||||||
| No. of Families Using Inputs | No. of Families | ||||||||
| Local | Improved | Hybrid | Local/ Organic | Mineral/ Chemical | Both | ||||
| Lumbini Province | 75,092 | 520,581 | 154,309 | 175,261 | 191,011 | 219,450 | 70,016 | 190,750 | 259,815 |
| Banke District | 63,885 | 59,395 | 18,588 | 12,516 | 28,291 | 27,496 | 6,886 | 14,528 | 37,981 |
| Nepalgunj Sub-Metropolitan City | 7,222 | 6,375 | 1,532 | 1,353 | 3,489 | 3,583 | 808 | 2,178 | 3,390 |
| Province/District/Local Level | Total Number of Agricultural Families | Maize | |||||||
|---|---|---|---|---|---|---|---|---|---|
| No. of Families | Type of Seeds | Families Using Pesticides | Use of Fertilizers | ||||||
| No. of Families Using Inputs | No. of Families | ||||||||
| Local | Improved | Hybrid | Local/ Organic | Mineral/ Chemical | Both | ||||
| Lumbini Province | 75,092 | 452,282 | 311,770 | 81,455 | 59,058 | 66,474 | 282,034 | 41,401 | 128,847 |
| Banke District | 63,885 | 63,885 | 25,840 | 13,089 | 5,752 | 6,999 | 5,903 | 12,933 | 4,022 |
| Nepalgunj Sub-Metropolitan City | 7,222 | 7,222 | 1,164 | 428 | 369 | 367 | 252 | 497 | 241 |
| Province/District/Local Level | Total Number of Agricultural Families | Wheat | |||||||
|---|---|---|---|---|---|---|---|---|---|
| No. of Families | Type of Seeds | Families Using Pesticides | Use of Fertilizers | ||||||
| No. of Families Using Inputs | No. of Families | ||||||||
| Local | Improved | Hybrid | Local/ Organic | Mineral/ Chemical | Both | ||||
| Lumbini Province | 75,092 | 495,137 | 266,944 | 228,192 | 132,833 | 176,623 | 164,064 | 154,450 | 495,137 |
| Banke District | 63,885 | 46,626 | 21,307 | 25,320 | 15,689 | 8,746 | 12,091 | 25,789 | 46,626 |
| Nepalgunj Sub-Metropolitan City | 7,222 | 5,885 | 2,017 | 3,868 | 1,789 | 1,244 | 1,947 | 2,693 | 5,885 |
| Province/ District/ Local Level | Total Agricultural Families | Domestic Animals | Domestic Birds | |||||||||||||||
|---|---|---|---|---|---|---|---|---|---|---|---|---|---|---|---|---|---|---|
| Total Families Raising Livestock | Cow/Ox | Buffalo | Goat/Chyangra | Sheep | Pig/Boar | Other Animals | Chicken | Other Birds | ||||||||||
| No. of Families | No. of Cow/Ox | No. of Families | No. of Buffalo | No. of Families | No. of Goat/Chyangra | No. of Families | No. of Sheep | No. of Families | No. of Pig/Boar | No. of Families | No. of Other Animals | No. of Families | No. of Chicken | No. of Families | No. of Other Birds | |||
| Lumbini Province | ||||||||||||||||||
| Banke District | ||||||||||||||||||
| Nepalgunj Sub-Metropolitan City | ||||||||||||||||||
| Province/District/ Local Level | Total Agricultural Families | Permanent Workers | Temporary Workers | Labor Exchange (Parma) Workers | Contract Workers | ||||||||||||
|---|---|---|---|---|---|---|---|---|---|---|---|---|---|---|---|---|---|
| Families Using Workers | Number of Permanent Workers | Families Using Workers | Temporary Worker Person-days | Families Using Workers | Labor Exchange Worker Person-days | Families Using Workers | Contract Worker Person-days | ||||||||||
| Total | Male | Female | Total | Male | Female | Total | Male | Female | Total | Male | Female | ||||||
| Lumbini Province | 75,092 | 5,163 | 10,942 | 5,923 | 5,019 | 290,350 | 7,231,030 | 2,464,998 | 4,766,032 | 290,560 | 4,532,270 | 1,427,936 | 3,104,334 | 8,525 | 140,745 | 62,315 | 78,431 |
| Banke District | 63,885 | 962 | 2,083 | 989 | 1,094 | 20,166 | 426,777 | 140,195 | 286,582 | 18,126 | 275,566 | 53,755 | 151,811 | 1,430 | 18,088 | 6,895 | 11,193 |
| Nepalgunj Sub-Metropolitan City | 7,222 | 50 | 100 | 87 | 13 | 2,475 | 36,933 | 12,373 | 24,561 | 2,157 | 20,347 | 9,586 | 10,761 | 113 | 588 | 313 | 275 |
| Province/ District/ Local Level | Total Agricultural Families | Families Taking Agricultural Loans | Families Stating Need for Additional Loans | Families Insured for Agricultural Activities | Families Receiving Government Grants |
|---|---|---|---|---|---|
| Lumbini Province | 75,092 | 71,651 | 193,373 | 30,160 | 54,205 |
| Banke District | 63,885 | 9,268 | 11,951 | 2,548 | 1,778 |
| Nepalgunj Sub-Metropolitan City | 7,222 | 1,090 | 2,767 | 326 | 201 |
| Province/District/Local Level | Total Number of Agricultural Families | Number of Agricultural Families Aware of Climate Change | Agricultural Families Stating Climate Change Impact on Agriculture | Agricultural Families According to Climate Change Impact on Agricultural Activities | |||||||||
|---|---|---|---|---|---|---|---|---|---|---|---|---|---|
| Decrease in Production | Increase in Production | Change in Size of Fruit/Crop | Change in Taste | Difference in Planting Time | More or Less Rainfall | Increase in Pest/Disease Outbreak | Change in Breeding Time | Loss/Emergence of Species | Other | ||||
| Lumbini Province | 75092 | 346768 | 314193 | 266768 | 32019 | 74468 | 54821 | 136711 | 180477 | 184875 | 13963 | 16175 | 576 |
| Banke District | 63885 | 29165 | 25915 | 21142 | 4804 | 7377 | 8286 | 9474 | 13537 | 14433 | 1512 | 2202 | 37 |
| Nepalgunj Sub-Metropolitan City | 7222 | 2408 | 2366 | 1739 | 338 | 251 | 339 | 626 | 464 | 1502 | 13 | 0 | 0 |
| Province/District/Local Level | Total Number of Agricultural Families | Number of Agricultural Families Managing Waste from Agricultural Practices | ||||||
|---|---|---|---|---|---|---|---|---|
| By Burying | By Burning | By Sending to Waste Managers | By Making Compost | Using as Fuel | By Other Methods | No Management Done | ||
| Lumbini Province | 75092 | 213317 | 368676 | 38617 | 382202 | 126581 | 196818 | 63116 |
| Banke District | 63885 | 16603 | 30357 | 5411 | 33972 | 5258 | 14894 | 3782 |
| Nepalgunj Sub-Metropolitan City | 7222 | 918 | 2023 | 1405 | 2119 | 162 | 2649 | 585 |
| Province/District/Local Level | Total Number of Agricultural Families | Number of Main Farmers by Gender | Agricultural Family Population | ||
|---|---|---|---|---|---|
| Male | Female | Male | Female | ||
| Lumbini Province | 75092 | 493454 | 271638 | 1786863 | 1919119 |
| Banke District | 63885 | 47447 | 20439 | 176262 | 177055 |
| Nepalgunj Sub-Metropolitan City | 7222 | 6093 | 1129 | 23774 | 21301 |
| Province/District/Local Level | Pop. of Families Participating in Formal Training | Pop. of Families Participating in Agr. Decisions | Pop. of Families According to Average Time Spent on Agr. Activities | |||||||||||
|---|---|---|---|---|---|---|---|---|---|---|---|---|---|---|
| Male | Female | Male | Female | Less (40%) | Approx. Half (40%-59%) | Most (60%-99%) | All (100%) | No Time Given | ||||||
| Male | Female | Male | Female | Male | Female | Male | Female | Male | Female | |||||
| Lumbini Province | 92890 | 87354 | 914553 | 965870 | 323413 | 302797 | 291516 | 320610 | 374507 | 430487 | 245286 | 326891 | 234527 | 241189 |
| Banke District | 9914 | 8891 | 83426 | 76239 | 33988 | 30959 | 28224 | 29301 | 32982 | 32217 | 25601 | 32298 | 23881 | 22990 |
| Nepalgunj Sub-Metropolitan City | 1067 | 779 | 9136 | 5463 | 2538 | 1794 | 4368 | 3941 | 4458 | 3486 | 3288 | 3061 | 5016 | 5009 |
| Province/District/Local Level | Total Number of Agricultural Families | Household Head | Agr. Practice Status | |||
|---|---|---|---|---|---|---|
| Main Farmer is Household Head | Other Person is Household Head | Single-Practice Family | Multi-Practice Family | Shared-Practice Family | ||
| Lumbini Province | 75092 | 695375 | 69717 | 746900 | 15470 | 2722 |
| Banke District | 63885 | 62281 | 5604 | 63648 | 4081 | 157 |
| Nepalgunj Sub-Metropolitan City | 7222 | 6984 | 239 | 7059 | 164 | 0 |
| Province/District/ Local Level | Total Number of Agricultural Families | Major Production Activities/Activities of Agricultural Practice | ||||||
|---|---|---|---|---|---|---|---|---|
| Food Crops | Vegetables | Fruits | Cash Crops | Livestock Farming | Poultry Farming | Other | ||
| Lumbini Province | 75092 | 707366 | 31756 | 1887 | 1521 | 17226 | 3248 | 2088 |
| Banke District | 63885 | 59873 | 5956 | 56 | 0 | 1621 | 284 | 96 |
| Nepalgunj Sub-Metropolitan City | 7222 | 6463 | 529 | 12 | 0 | 193 | 13 | 12 |
| Province/District/Local Level | Total Number of Agricultural Families | Major Use of Agricultural Production | |||
|---|---|---|---|---|---|
| All Household Use | Mainly HH Use and Some Sale | Mainly Sale and Some HH Use | All Sale | ||
| Lumbini Province | 75092 | 533075 | 204059 | 25221 | 2737 |
| Banke District | 63885 | 50429 | 15601 | 1622 | 233 |
| Nepalgunj Sub-Metropolitan City | 7222 | 5010 | 1548 | 626 | 38 |
| Province/ District/ Local Level | Total Number of Agricultural Families | Major Source of Income of Agr. Family | Families whose Income from Own Production is Insufficient for the Year | Number of Families According to Duration of Food Insufficiency | ||||
|---|---|---|---|---|---|---|---|---|
| Agriculture | Non-Agriculture | 1 to 3 Months | 4 to 6 Months | 7 to 9 Months | 10 to 12 Months | |||
| Lumbini Province | 75092 | 507488 | 257604 | 390474 | 97342 | 175354 | 85524 | 32253 |
| Banke District | 63885 | 46448 | 21438 | 29801 | 8128 | 10661 | 6475 | 4537 |
| Nepalgunj Sub-Metropolitan City | 7222 | 5461 | 1761 | 4145 | 1303 | 1630 | 917 | 296 |
4.6 Agricultural Land Use Details
When analyzing what crops are planted in what area by agricultural practice, according to the National Agriculture Census results, out of 7,222 total agricultural families in this sub-metropolitan city, 7,054 families are engaged in agricultural practices on cultivable land, with a total area of 4,044.0 hectares, which is 91.17%.
Out of the total area, 4,023.8 hectares (90.72%) are under temporary crops by all 7,054 families. Likewise, 100 agricultural families have 20.2 hectares (0.46%) under other cultivable land. Furthermore, 640 agricultural families use 57.9 hectares (2.19%) for permanent crops. Similarly, the area of permanent pastures, private open spaces, ponds, and other land is 294.4 hectares (6.64%).
| Province/District/Local Level | Total Number of Agricultural Families | Total Area of Land Used by Agricultural Families | Total Cultivable Land | Land Under Temporary Crops | Other Cultivable Land | Land Under Permanent Crops | Other Land | |||||
|---|---|---|---|---|---|---|---|---|---|---|---|---|
| No. of Families | Area (Hectare) | No. of Families | Area (Hectare) | No. of Families | Area (Hectare) | No. of Families | Area (Hectare) | No. of Families | Area (Hectare) | |||
| Lumbini Province | ||||||||||||
| Banke District | ||||||||||||
| Nepalgunj Sub-Metropolitan City | ||||||||||||
4.6.1 Diseases and Pests Affecting Food Crops
In order to obtain the expected production from agricultural crops, proper care and maintenance of crops is necessary. Especially since crops are attacked by diseases and pests, it is essential to take high vigilance in a timely manner to avoid diseases and pests and to gain knowledge about prevention. On the other hand, it is also necessary to correctly identify the diseases and pests that can attack crops. If the diseases and pests can be correctly identified, their prevention can be done in time and production can be secured and increased.
| S.N. | Crop | Major Pests | Major Diseases |
|---|---|---|---|
| 1 | Paddy | BPH, Grasshopper, Stem Borer, Hispa | Blast, Blight, Khaira Disease |
| 2 | Wheat | Aphids, Termites, Lahi | Loose Smut, Yellow Rust, Brown Rust, Blight, Smelling Loose Smut, etc. |
| 3 | Maize | American Fall Armyworm, White Grub, Stem Borer, Cutworm, etc. | Grey Leaf Spot, Northern Leaf Blight, Southern Leaf Blight, Stalk Rot, etc. |
| 4 | Mustard | Sawfly, Lahi | Sawfly, Lahi, etc. |
| 5 | Potato | Cutworm, Potato Tuber Moth, Red Ant, Lahi, etc. | Cutworm, Potato Tuber Moth, Red Ant, Lahi, etc. |
4.6.2 Diseases and Pests in Vegetables and Fruits
| S.N. | Crop | Major Diseases | Major Pests |
|---|---|---|---|
| 1 | Tomato | Tuta absoluta, Whitefly, Aphids, Fruit borer, Shield bug, etc. | Early Blight, Late Blight, Mosaic, etc. |
| 2 | Cauliflower, Cabbage | Diamondback Moth, Tobacco Caterpillar, Aphids, Flea Hopper, etc. | Soft Rot, Black Rot, Alternaria, Club Root, Damping Off, etc. |
| 3 | Potato | Late Blight, Mosaic, Brown Pith, Cutworm, Aphids, Leaf Spot, etc. | Potato Tuber Moth, Red Ant, Leaf Eating Caterpillar, etc. |
| 4 | Mustard Greens (Rayo) | Diamondback Moth, Tobacco Caterpillar, Aphids, Flea Hopper, etc. | Soft Rot, Black Rot, Alternaria, Club Root, Damping Off, etc. |
| 5 | Citrus (Lemon) | Shield bug, Aphids, Fruit fly, Scale insects, Root rot, Foot rot, Mildew, Leaf miner, Pink disease, Anthracnose, Citrus scab, Gummosis, Sooty mould, Canker, Citrus greening, (Citrus tristeza virus CTV), Lemon dog, etc. | Canker, Foot rot, Green bug, Fruit fly, Sooty mould, Citrus psylla, Leaf miner, Red spider mite, Blue beetle, Stem & Trunk borer, Aphids, Thrips, Nematodes, Lemon butterfly, etc. |
4.6.3 Diseases and Pests in Livestock and Poultry
Livestock and poultry farming, as a major source of income for farmers, is one of the main professions of this sub-metropolitan city. Animal diseases seen in the sub-metropolitan city include Rabies, Foot and Mouth Disease (FMD), PPR, Swine Fever, Hemorrhagic Septicemia, Black Quarter, Liver Fluke, Mate, Mastitis, reproductive issues, and worms. Anti-rabies vaccination seems necessary in wards connected to forests, while outbreaks of highly contagious diseases like FMD, PPR, and Swine Fever are occasionally seen. Causes for this include illegal movement of animals, poor management, and lack of awareness about vaccination. Continuous efforts are being made by the sub-metropolitan city for the control of these diseases.
Among bacterial diseases, farmers in this sub-metropolitan city vaccinate against Hemorrhagic Septicemia and Black Quarter. However, these diseases are seen sporadically. If vaccination against Swine Fever, FMD, and Rabies can be operated in various wards, it seems control will be successful to a large extent. Generally, large epidemics are not found in livestock/poultry. However, FMD, Hemorrhagic Septicemia, Black Quarter, Liver Fluke, and Rabies remain common in livestock, while Newcastle disease (Ranikhet), Gumboro, CRD, and Bird Flu are primarily found in birds.
4.6.4 Details of Commercial Agriculture and Animal Husbandry Farms
Most areas of Nepal still practice subsistence-oriented, traditional, and unorganized farming. To make agriculture a respected, profitable, and scientific profession, it needs to be developed in an organized and institutional manner. Currently, commercial agriculture farms have been registered in various parts of the country and the practice of organized and institutional farming has begun. By registering farms scientifically and operating agricultural businesses, it becomes easier to receive government subsidies and technical support. This also helps to make the agricultural business organized and professional. The details of agriculture and animal husbandry farms within this Sub-Metropolitan City are included in Annex 6.
4.6.5 Details of Agriculture and Animal Husbandry Related Groups and Community Organizations
Various agriculture groups are currently operating to commercialize and modernize traditional farming. These groups facilitate agricultural business while providing energy to entrepreneurs by offering certain services and facilities. Details of farmer groups help understand the involvement of farmers in the agricultural sector and the status of agricultural activities in the sub-metropolitan city, while also helping to identify what programs need to be brought in the coming days. The details of farmer groups are included in the table below.
| S.N. | Group Name | Ward No. | Contact Person |
|---|---|---|---|
| 1 | Makbul Ahmad Kuraisi | 14 | Jaispur Smart Agriculture Village Implementation Committee |
| 2 | Pashu Bikas Krishak Samuh | 19 | Balram Pun Magar |
| 3 | Yaduwanshi Pashu Palan Krishak Samuh | 20 | Ram Kumar Yadav |
| 4 | Gopalwanshi Pashupalan Farm | 20 | Binod Kumar Yadav |
| 5 | Jamuna Machha Tatha Bakhapalan Krishak Samuh | 21 | Rijwan Khan |
| 6 | Shri Ujjawal Machha Tatha Pashupalan Krishak Samuh | 21 | Dhakendra Sunar |
| 7 | Kalika Bakhapalan Krishak Samuh | 20 | Dal Bahadur Rawat |
| 8 | Shri Lumbini Krishi Pashupankhshi Tatha Machha Palan Krishak Samuh | 14 | Aftab Ansari |
| 9 | Shivshakti Mahila Krishak Samuh | 19 | Nandakala Khadka |
| 10 | Shri Jai Bageshwari Krishak Samuh | 20 | Ramkumar Yadav |
| 11 | Shri Malati Krishak Samuh | 01 | Hemraj Pokharel |
| 12 | Bali Bikas Krishak Samuh | 16 | Jambar Kapadiya |
| 13 | Shri Islam Krishak Samuh | 21 | Atiullah Bagwan |
| 14 | Radhakrishna Krishak Samuh | 22 | Gopi Pr. Yadav |
| 15 | Jai Bageshwari Krishak Samuh | 15 | Prahlad Barma |
| 16 | Mausami Krishak Samuh | 22 | Ibrahim Khan |
| 17 | Bhrikuti Organic Shahri Krishak Samuh | 10 | Narayan Sigdel |
| 18 | Milijuli Organic Shahri Krishak Samuh | 18 | Renu Gharti |
| 19 | Shanti Organic Shahri Krishak Samuh | 01 | Amuta Giri |
| 20 | Belasapur Karmohana Smart Samiti | 13 | Pramatma Barma |
| 21 | Krishna Pranggarik Nal Utpadan Krishak Samuh | 20 | Dhaneshwar Gautam |
| 22 | Samaweshi Tol Bikas Krishak Samuh | 06 | Ganesh Kumar G.C. |
4.6.6 Collection Center and Chilling Center
In an environment where large-scale agricultural production and collection center arrangements are lacking, developing collection centers at various convenient locations for small-quantity produce can help in marketing. Developing collection centers at various places helps traders purchase produce from specific locations in specific quantities, thereby supporting the development of the market system.
Just as increasing agricultural production is necessary, safe storage of produced goods is equally important. Proper storage helps maintain the nutritional value of agricultural produce. Without scientific storage, the quality of produce deteriorates on one hand and it may also be destroyed. Therefore, storing agricultural produce scientifically and making it available in the market even off-season helps maintain market price stability. For this, it is necessary to establish chilling centers, storage centers, and dairies at various locations based on need. Currently, traders in this Sub-Metropolitan City conduct food trade by privately managing ordinary and traditional storage.
4.7 Tourism Development
Nepal is known worldwide as an attractive tourist destination due to its climate, way of life, forests, flora and fauna, and cultural diversity created by its unique geographical structure. Tourism is a gift of nature to us. It is certain that the full utilization of all these tourism assets will make a significant contribution to the country's economic prosperity and strengthen the national economy. Therefore, Tourism Policy 2065 aims to create self-employment through tourism, alleviate poverty, research tangible and intangible heritage, further develop and expand air and land routes, and advance tourism infrastructure in line with the concept of sustainable development. This Sub-Metropolitan City also has abundant potential for tourism development.
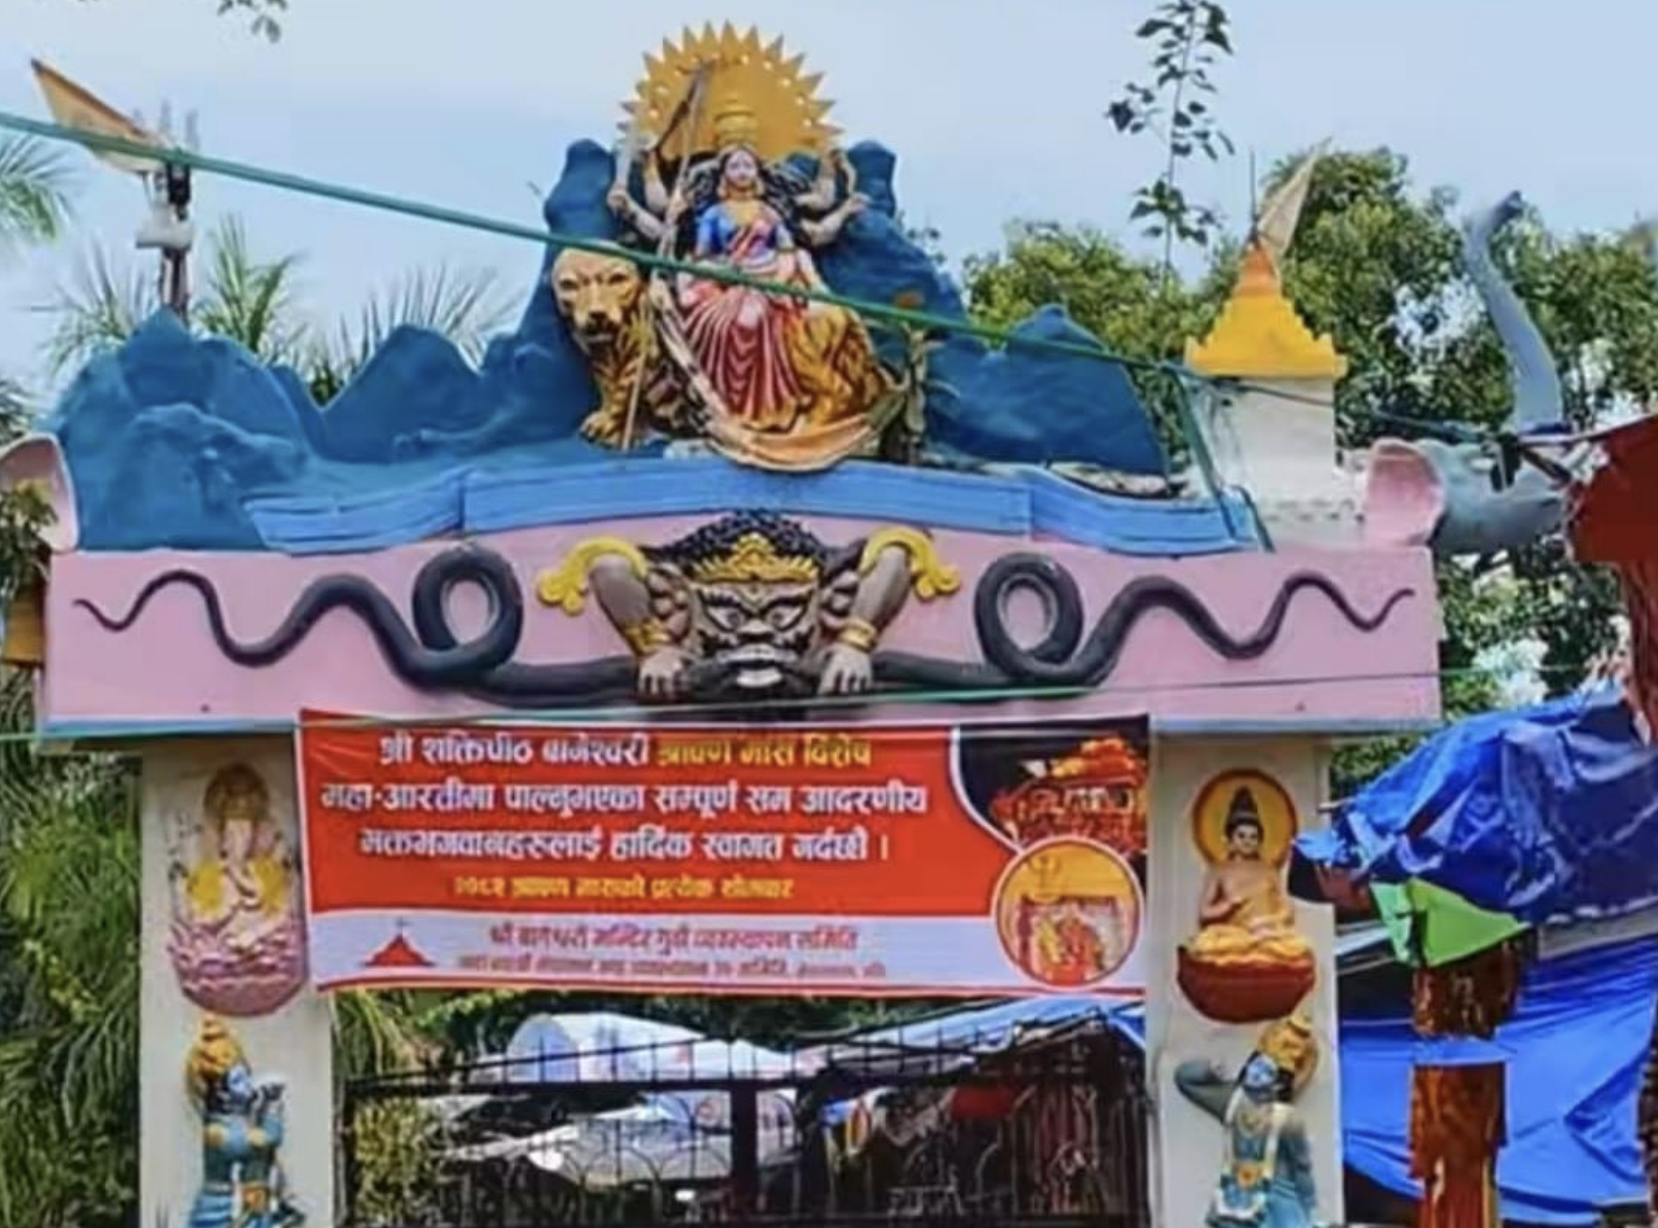
Within the Sub-Metropolitan City, there are more than 30 sites of religious, historical and archaeological importance including the famous Bageshwari Temple, the statue of Mahadev with a beard, Rani Talau, Mahendra Park, Jamjam Mosque, Jama Mosque, Phulbari Mosque, Bhawani Bagh Talau, and Ramlila Maidan. There is equally great potential for homestay and cultural tourism. Cultural tourism can be promoted by incorporating various cultural programs reflecting the culture of the Magar and Tharu communities. Additionally, since the Sub-Metropolitan City is a leading producer of agricultural products, fruits, grain crops, and turmeric, developing those areas as model agricultural zones could attract agro-tourists. Therefore, it is currently necessary to expand hotels, homestays, and other necessary services and facilities for tourists.
4.7.1 Religious and Tourist Places Details
Nepalgunj Sub-Metropolitan City is characterized by multi-ethnic, multi-lingual, multi-religious and social diversity, and contains traditional temples, mosques and historical sites. The details of various tourist and religious sites in this sub-metropolitan city are mentioned in the table below.
| S.N. | Name | Importance |
|---|---|---|
| 1 | Bageshwori Temple | Religious and Tourist |
| 2 | Rani Talau | Religious and Tourist Area |
| 3 | Statue of Mahadev with Moustache | Cultural and Religious |
| 4 | Mahendra Park | Tourist Area |
| 5 | Jamjam Masjid | Cultural and Religious |
| 6 | Phulbari Masjid | Cultural and Religious |
| 7 | Bhawani Bagh Talau | Tourist Area |
| 8 | Ramlila Maidan | Tourist Area |
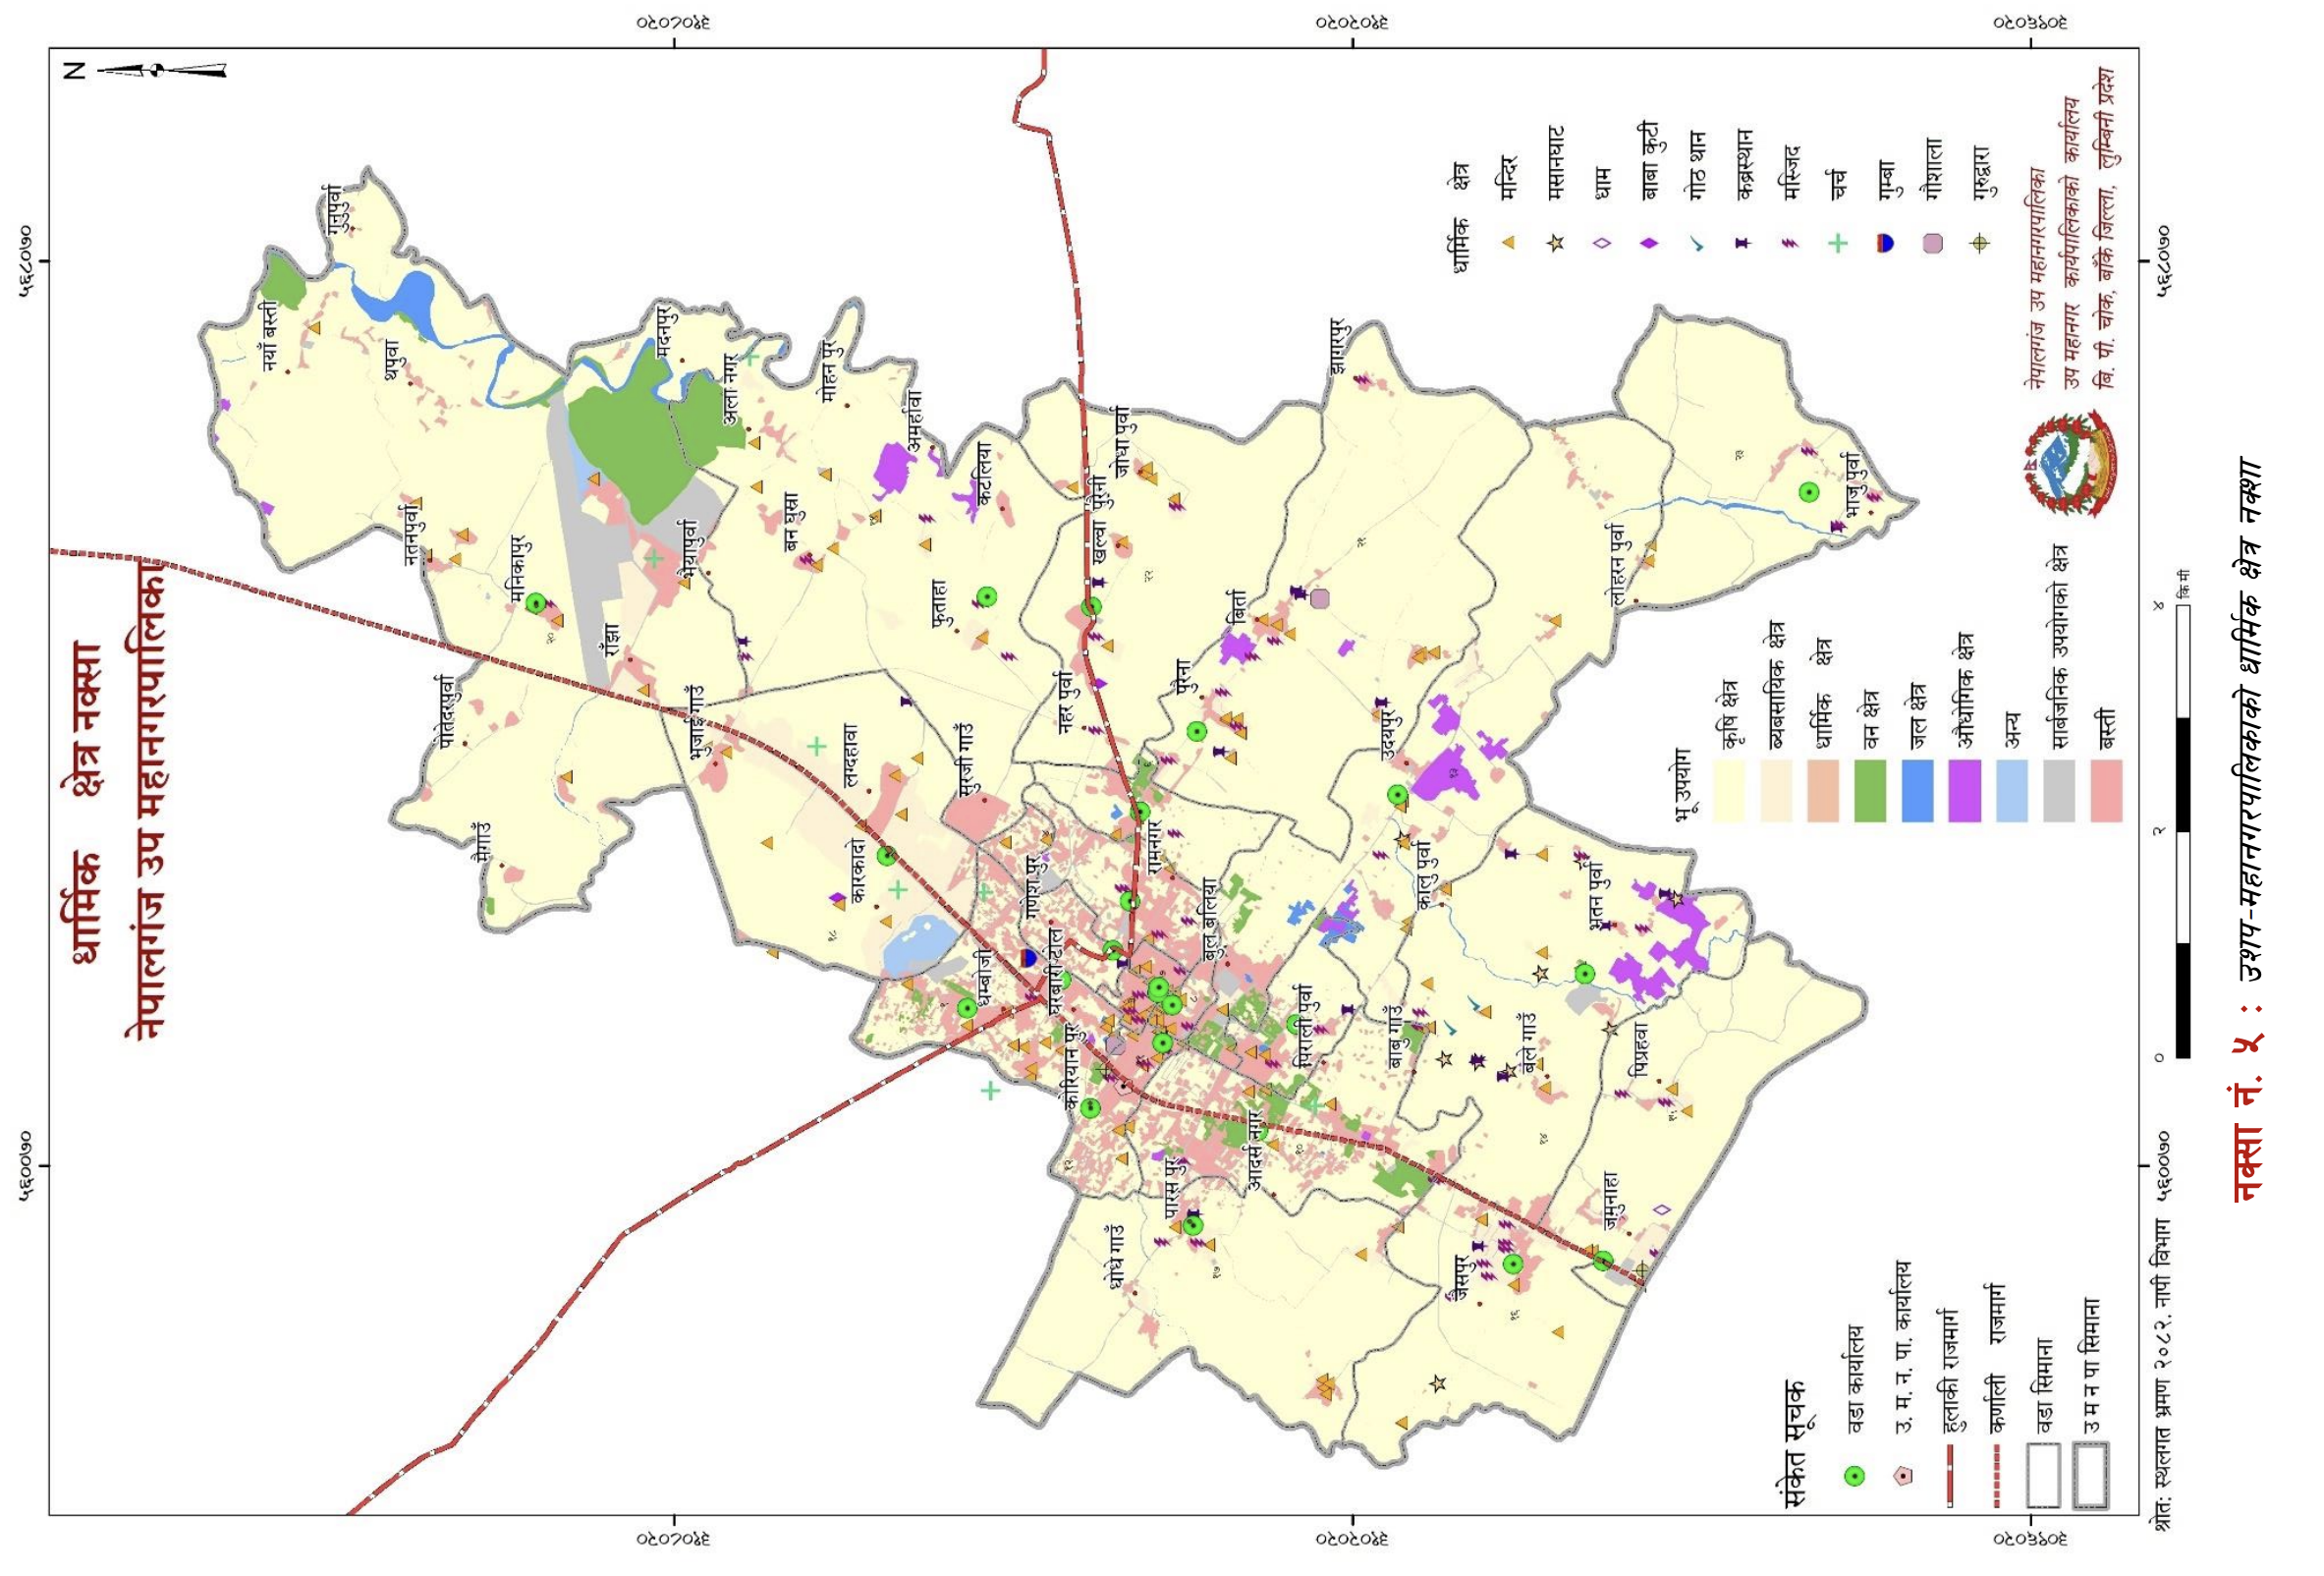
Map No. 5: Religious Places Map of Nepalgunj Sub-Metropolitan City
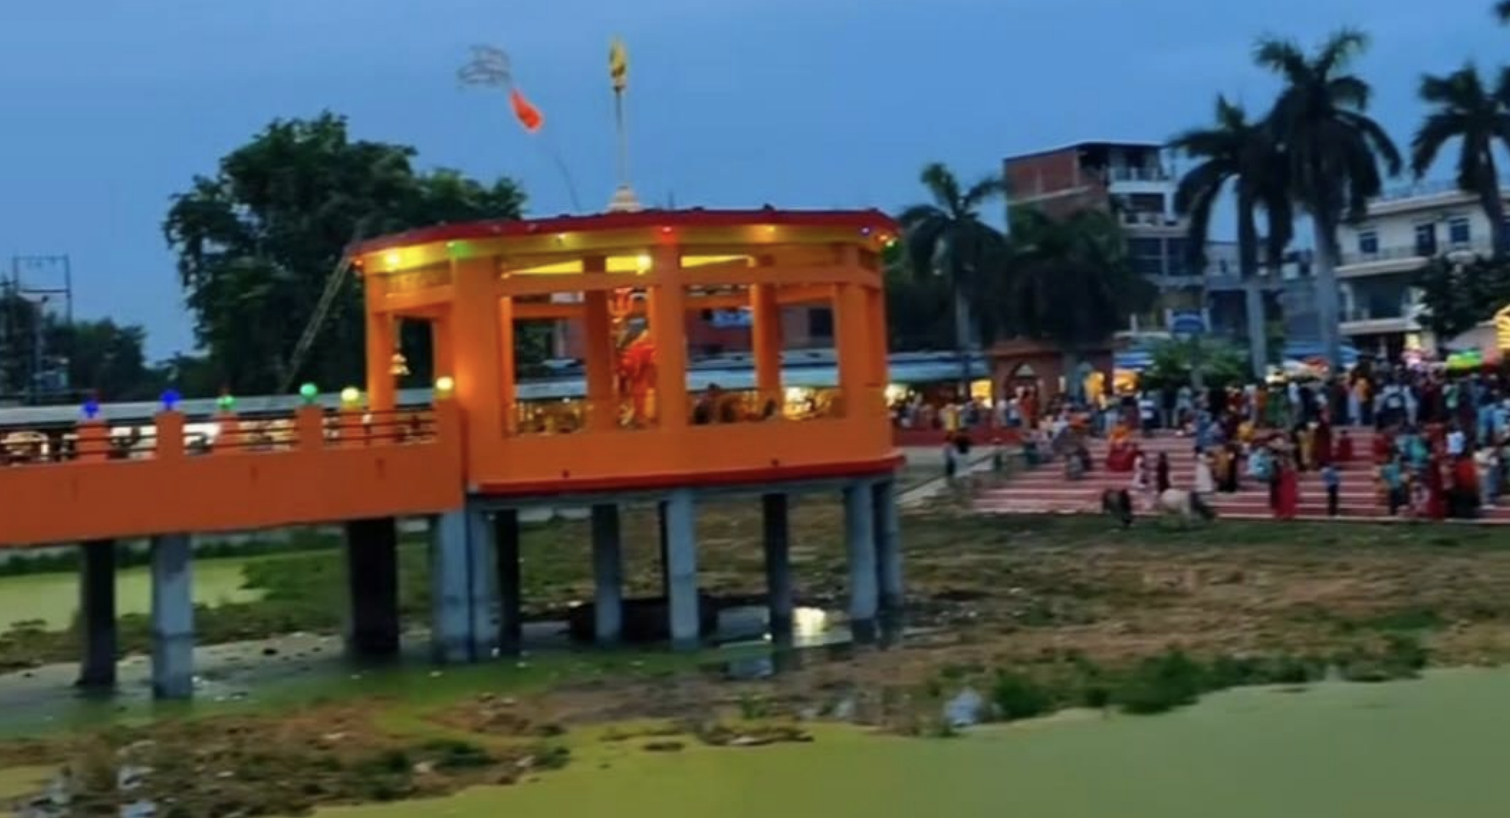
Rani Talau
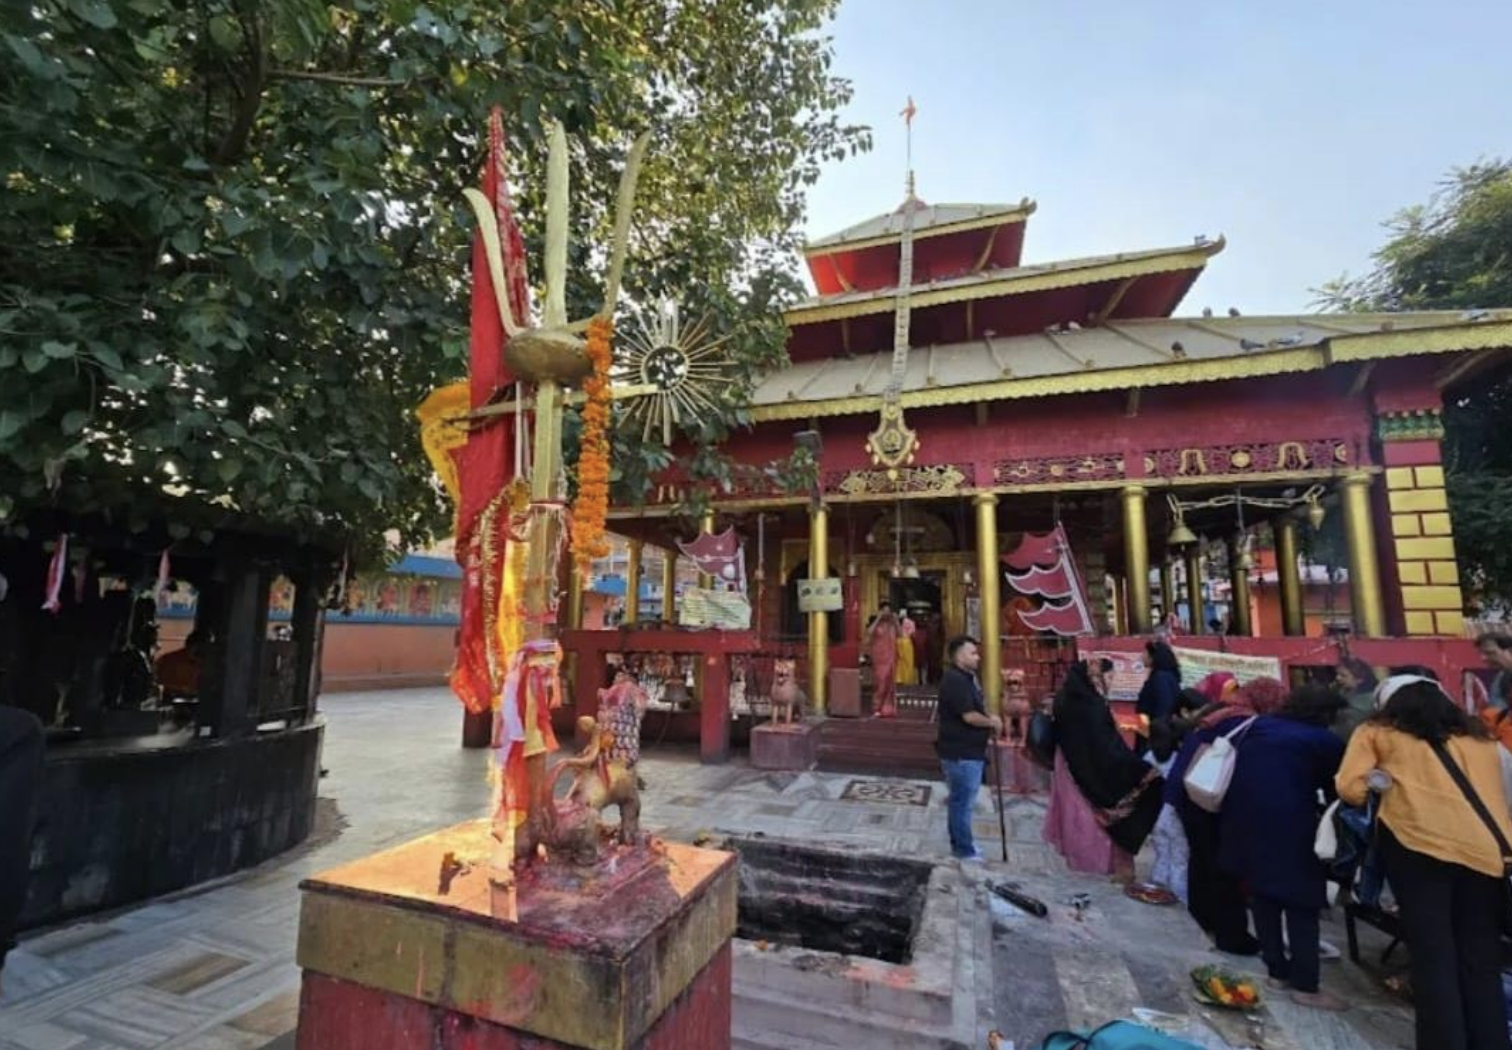
Bageshwori Temple
Temple
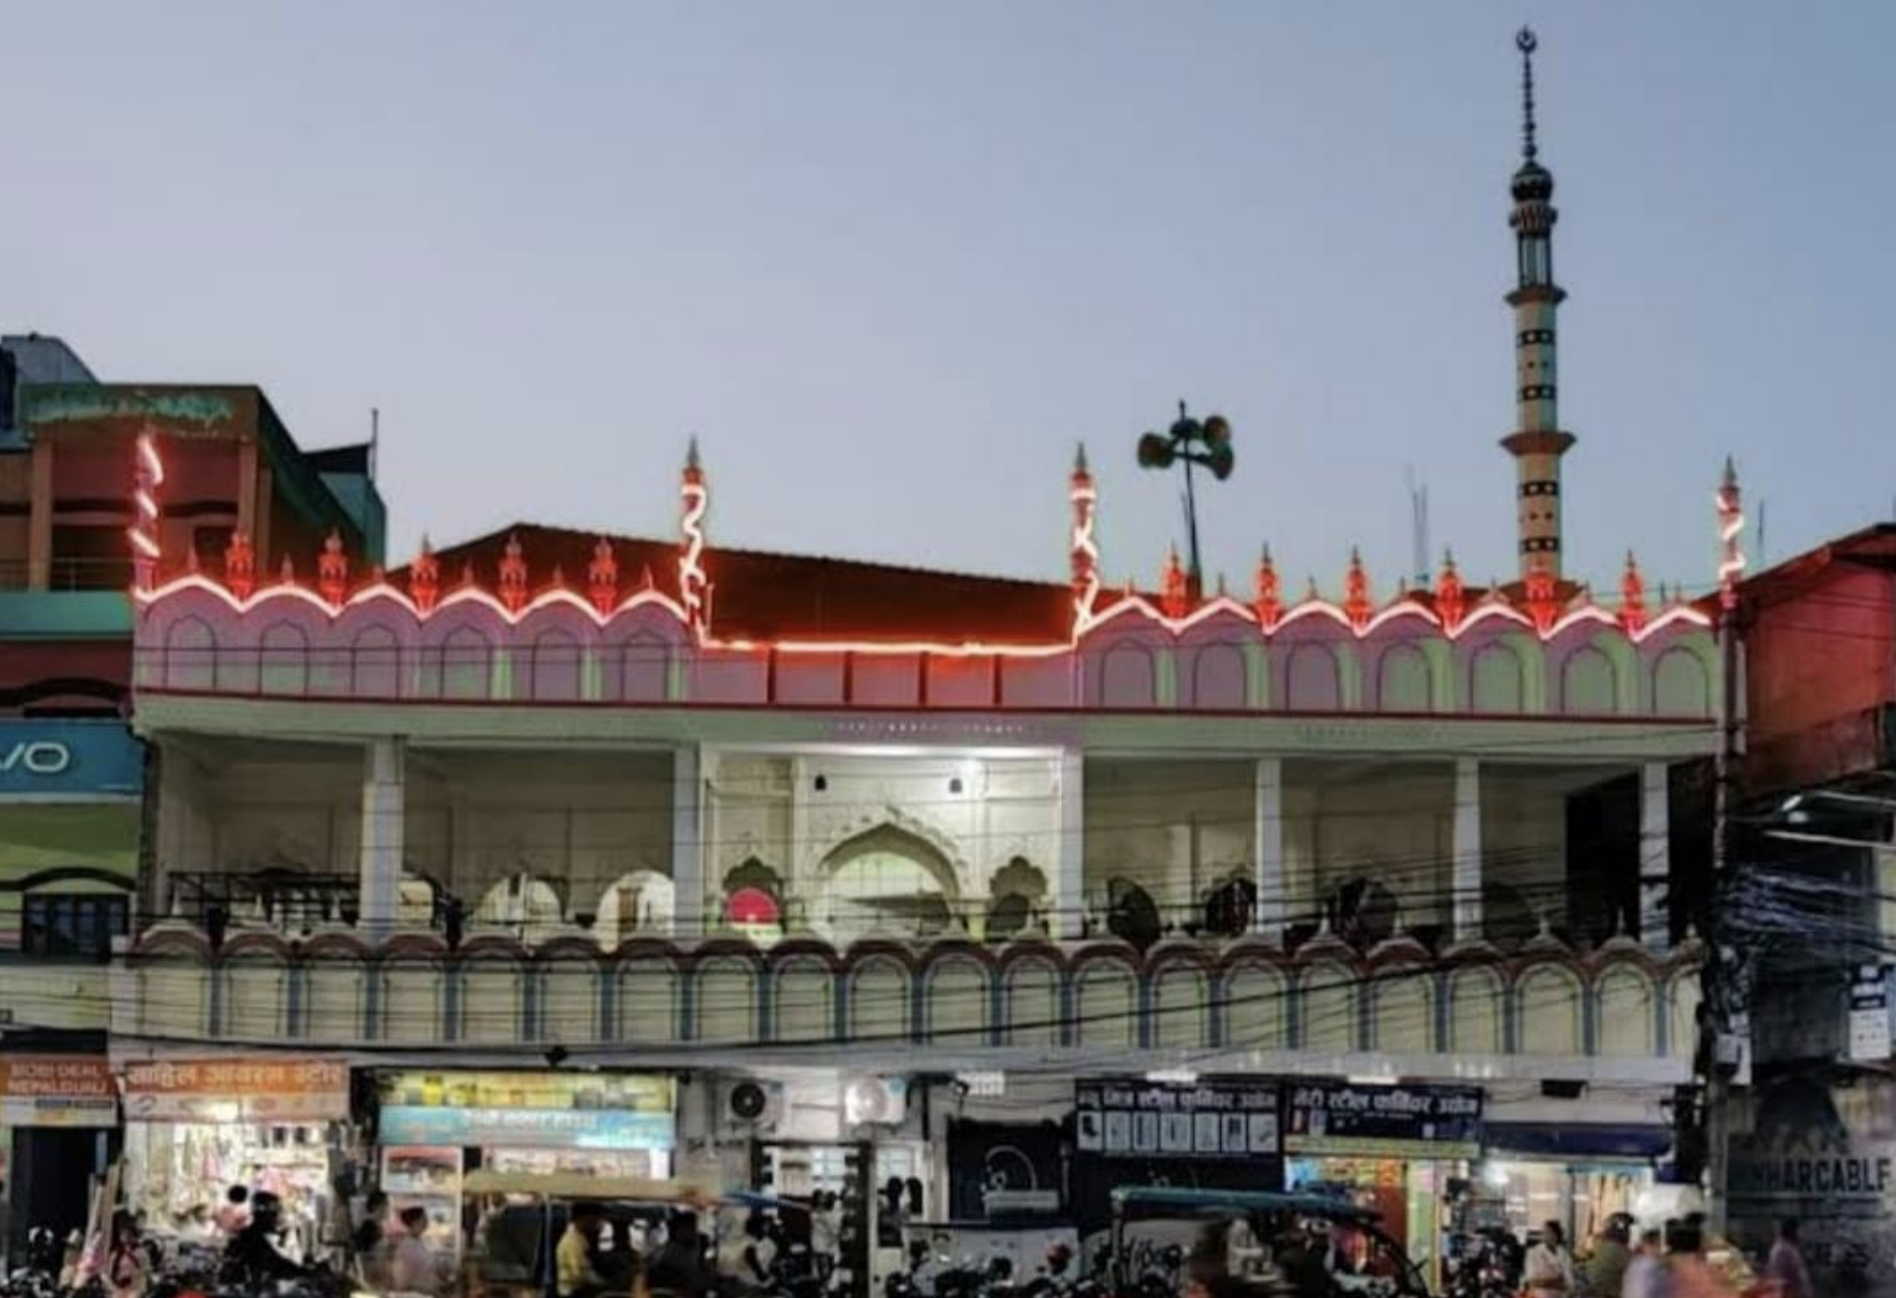
Dhamboji Masjid
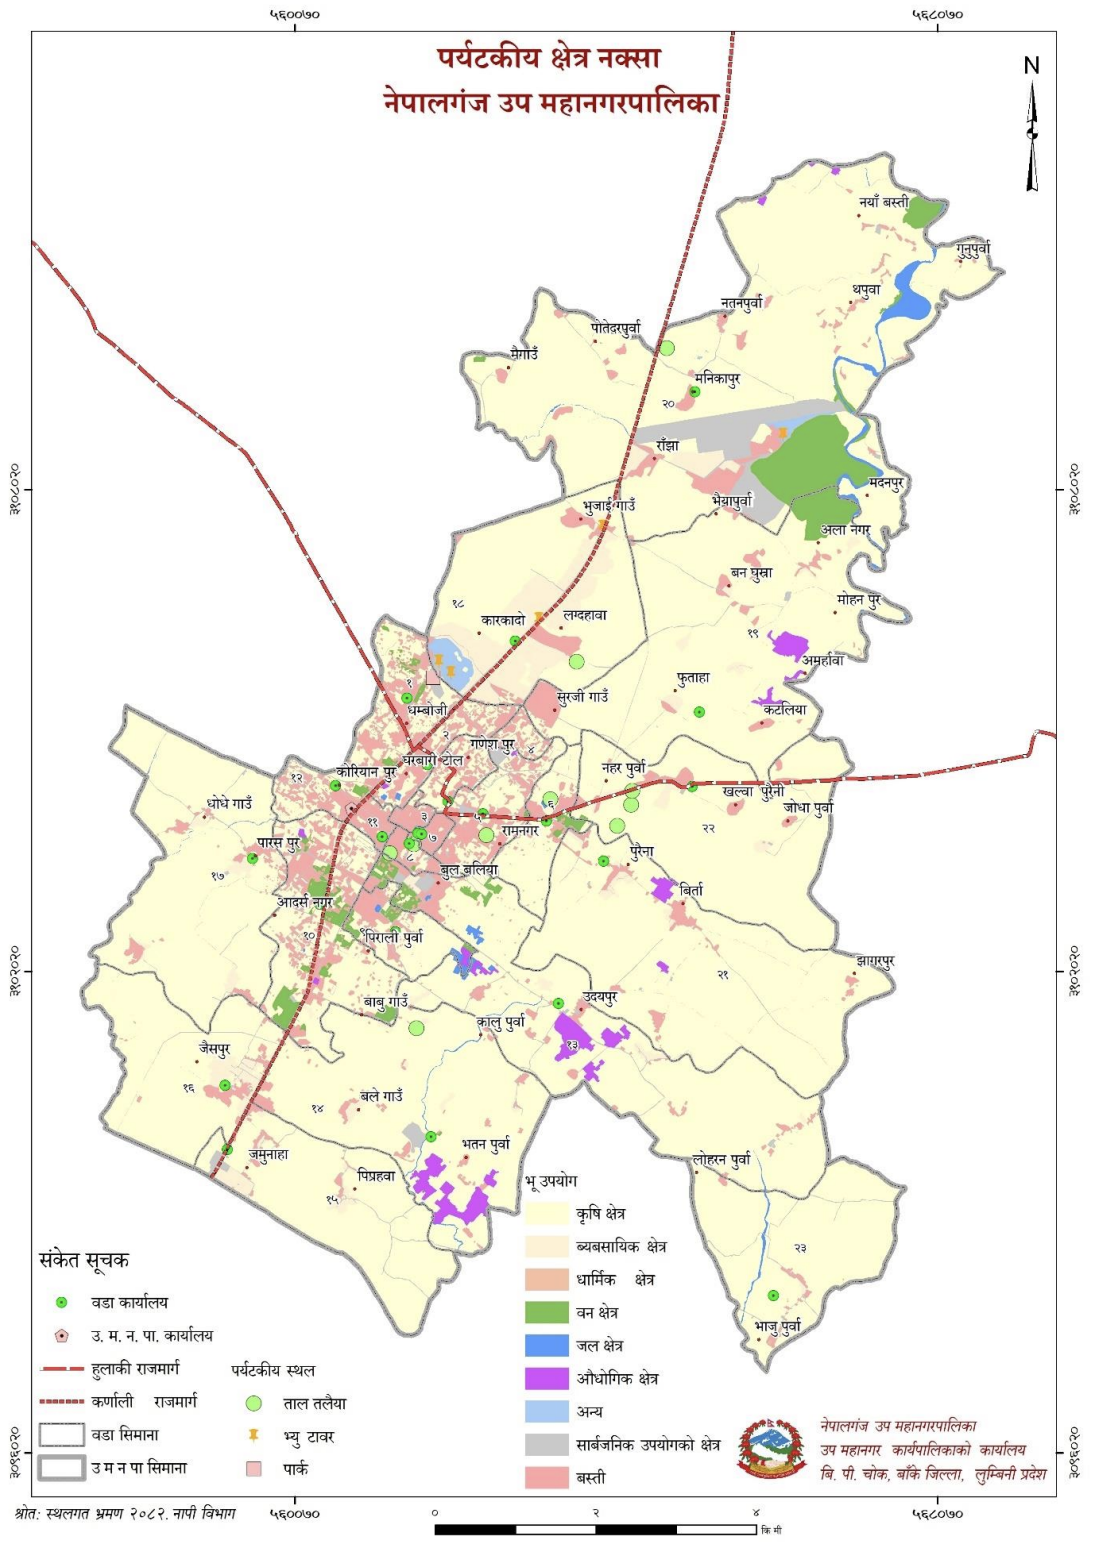
Map No. 6: Tourist Area Map of the Sub-Metropolitan City
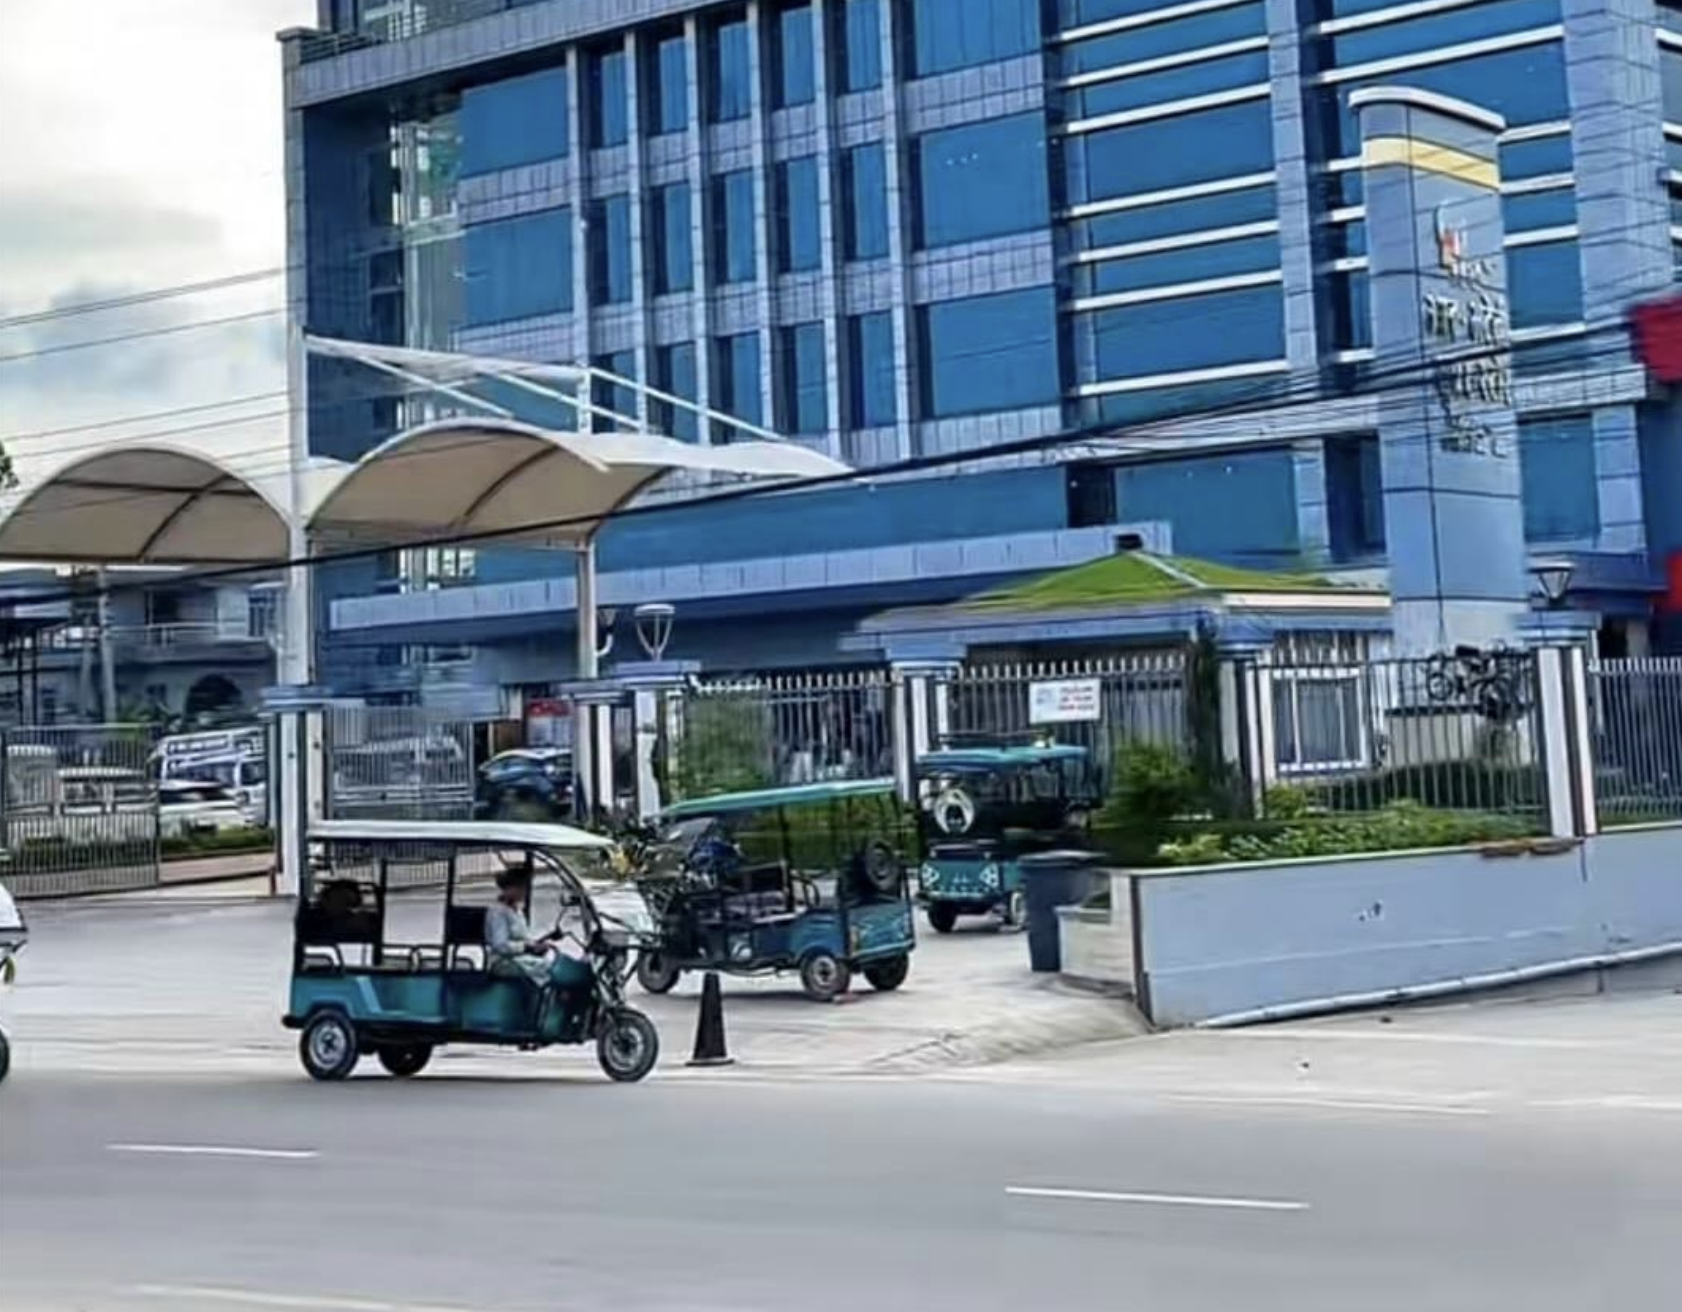
4.7.2 Hotel, Resort and Restaurant Description
It is mandatory to properly develop all infrastructures related to a sector for the development of any sector. Although there is abundant potential for tourism in Nepal, the lack of tourism infrastructure has hindered the widespread development of the tourism sector. Tourism infrastructures include convenient transportation facilities, hotels, lodges and restaurants, tourist guides, information centers, rescue mechanisms, communication, security, and tourist activities. Looking at the prospect of tourism, it is indispensable to develop these infrastructures gradually based on the requirements for tourism development. The details of hotels, resorts and restaurants in this sub-metropolitan city are mentioned in Schedule 4.
4.8 Industry, Trade and Banking
After the development of agriculture, industry is the necessary sector for the economic revolution of any country. Although various efforts have been made since the Rana regime for industrial development, large-scale industries capable of bringing about an industrial revolution have not been able to open in Nepal. It is unfortunate that even existing industries are becoming sick and closing down. Only if we can establish industries based on agriculture and local raw materials along with the development of agriculture and advance the consumption of Nepalese products in the global market, will a base be prepared for Nepal to rise above an under-developed nation. In this sub-metropolitan city, small and large micro-enterprises and trade businesses are operating, while for banking services, more than 40 banks and financial institutions are active in transactions. To promote industry, it is equally necessary to prioritize and encourage small and medium industries based on local resources.
4.8.1 Industrial Development (Micro, Cottage, Small, Medium, Large Industry, Government, Public, Private and Cooperative)
Although various efforts have been made since the Rana regime for industrial development, large-scale industries capable of bringing about an industrial revolution have not been able to open in Nepal. It is unfortunate that even existing industries are becoming sick and closing down. Only if we can establish industries based on agriculture and local raw materials along with the development of agriculture and advance the consumption of Nepalese products in the global market, will a base be prepared for Nepal to rise above an under-developed nation. To promote industry, it is equally necessary to prioritize and encourage small and medium industries based on local resources.
Including small industries, all types of agro-based industries, cottage industries, medium industries, large industries, service-oriented industries, government industries, community-based industries, collection and processing industries, 9,024 trade businesses and industries have been formally registered and are operating in the sub-metropolitan city, while 786 hotels and businesses are registered and operating.
4.8.2 Trade/Business Description
Trade is a sector that is inextricably linked with the development of the agriculture and industry sectors. Since trade is the medium to bring goods produced through agriculture and industry to national and international markets, the development of trade and commerce is extremely important. In order to be economically strong, local levels must become strong in local production and reach a state where they can export. The economy cannot rise by trading goods produced outside of one's own area. For this, in one way or another, it is necessary to focus on local production and be able to export such products. The details of trade/businesses in this sub-metropolitan city are mentioned in the table.
| S.N. | Business Group | Number |
|---|---|---|
| 1 | Other Businesses | 84 |
| 2 | Other Services | 176 |
| 3 | Productive Industry | 121 |
| 4 | Cottage Industry and Other Industries | 411 |
| 5 | Construction Business | 221 |
| 6 | Wholesale and retail trade of items such as construction materials, computers, electrical goods, cameras, televisions, radios, carpets, petroleum products | 300 |
| 7 | Tourism Industry | 786 |
| 8 | Commercial Goods | 3701 |
| 9 | Maintenance Service | 379 |
| 10 | Financial Services and Non-Governmental Organizations | 230 |
| 11 | Expert Consulting and Other Professional Services | 118 |
| 12 | Education side | 259 |
| 13 | Vehicle Sellers | 163 |
| 14 | Service Industry | 323 |
| 15 | Communication Service | 11 |
| 16 | Health Service | 244 |
| 17 | Real Estate towards Housing Company and Real Estate Purchase/Sale | 15 |
| Total | 7482 |
4.8.3 Local Market and Commercial Centers
Market Area
Apart from the big cities of the country, in areas with dense settlements in rural areas, human activities such as education, health, other services, trade and commerce are found to be concentrated. Such centers are called market centers. Although they have not been fully developed from the perspective of urban development and facilities, such centers are found to be concentrating and developing human activities as areas that can be developed in the future. It is not that markets cannot be developed in new areas looking at suitability; however, it is easy to further develop such areas that have already been developed to some extent. The main commercial centers of this sub-metropolitan city are as follows.
Gharbari Tole Market Area
| Ward No. | Commercial Area |
|---|---|
| 1 | Dhamboji, Khajura Road |
| 2 | Gharbari Tole |
| 3 | Surajline, Eklaini, Birendra Keshari Tole, Sonar Tole, Bishkoriyan Tole |
| 5 | Phultekra |
| 6 | Phultekra Area |
| 7 | Sahawa Mod, Pipal Chautara |
| 8 | Tribhuvan Chowk, Sadar Line |
| 9 | Ramlila Road, Charbahini Army Barrack, Electricity Office |
| 10 | Charbahini Chowk, Surkhet Road, Ganeshman Chowk Industrial Area |
| 11 | Surkhet Road, Pasang Marga, Sadar Line, Idgah Road, Sunar Mandi |
| 12 | B.P. Chowk Surkhet Road, Kaushalya Marga, Belaspur |
| 13 | Ramlila Maidan, Nepal Bank Road from Mero Hospital, Udayapur Chauraha |
| 14 | Balegaun, Babugaun, Chaulikka, Bhatanpurwa |
| 15 | Jamunaha Chauki |
| 16 | Bhansar, Kabrastan, Ismail Chowk, Shiva Temple |
| 17 | Paraspur, Bhruti Nagar |
| 18 | Karkado |
| 19 | Bhaiyapur, Sujigaun, Katalia, Alannagar, Mohanpur |
| 20 | Ranjha Airport |
| 21 | Nayanbasti, Birta |
| 22 | Shantichowk, Narapurwa, Pureni Bazar, Kasnital Chowk |
| 23 | Bekari Singh Purwa, Bhajjupurwa, Loharpurwa |
4.8.4 Bank and Financial Institution
Sadar Line Road Bazar
4.8.4 Bank and Financial Institution Details
In a modern economy, when financial transactions take place through banks, it becomes systematic and easy. With the extensive development in banking systems, the services provided by them are also expanding. Currently, various banks have made arrangements for ATM services, Visa card services, bill payment services, and even insurance. In this sense, it has become essential to provide access to banking services to rural people in a modern economic system. In this sub-metropolitan city, banking transactions are conducted through 30 banks and financial institutions, while 111 cooperative societies are actively operating here. In addition to this, financial transactions are also conducted through various savings groups. The details of banks and financial institutions here are included in the table below.
| S.N. | Name of Bank and Financial Institution | Category |
|---|---|---|
| 1 | Nepal Bank Limited | Commercial Bank (A) |
| 2 | Rastriya Banijya Bank | Commercial Bank (A) |
| 3 | Nabil Bank | Commercial Bank (A) |
| 4 | Global IME Bank | Commercial Bank (A) |
| 5 | NIC Asia Bank | Commercial Bank (A) |
| 6 | Nepal Investment Mega Bank | Commercial Bank (A) |
| 7 | Himalayan Bank | Commercial Bank (A) |
| 8 | Everest Bank | Commercial Bank (A) |
| 9 | Prabhu Bank | Commercial Bank (A) |
| 10 | Kumari Bank | Commercial Bank (A) |
| 11 | Citizens Bank International | Commercial Bank (A) |
| 12 | Prime Commercial Bank | Commercial Bank (A) |
| 13 | Sanima Bank | Commercial Bank (A) |
| 14 | Machhapuchchhre Bank | Commercial Bank (A) |
| 15 | Standard Chartered Bank Nepal | Commercial Bank (A) |
| 16 | Karnali Development Bank | Development Bank (B) |
| 17 | Muktinath Bikas Bank | Development Bank (B) |
| 18 | Shine Resunga Development Bank | Development Bank (B) |
| 19 | Garima Bikas Bank | Development Bank (B) |
| 20 | Sangrila Development Bank | Development Bank (B) |
| 21 | ICFC Finance | Finance Company (C) |
| 22 | Manjushree Finance | Finance Company (C) |
| 23 | Best Finance Company | Finance Company (C) |
| 24 | Nirdhan Utthan Laghubitta | Microfinance (D) |
| 25 | Chhimek Laghubitta | Microfinance (D) |
| 26 | Deprosc Laghubitta | Microfinance (D) |
| 27 | Forward Microfinance | Microfinance (D) |
| 28 | Civil Laghubitta | Microfinance (D) |
| 29 | Sana Kisan Laghubitta | Microfinance (D) |
| 30 | Nerude Laghubitta | Microfinance (D) |
4.8.5 Cooperative Organizations
The role of cooperative societies in the economic and social development of the sub-metropolitan city is significant. Cooperative societies prevent local level savings from going out of the sub-metropolitan city and invest in various income-generating activities in the local area.
With the increase in people's ownership of cooperative societies and reduction in administrative hassles, people's access to the financial sector has also increased. Loan investment is made through savings and credit, agriculture, consumer, and multipurpose cooperative societies with the intention of investing in the city's industry and trade sector. At the same time, it is seen that these institutions have been regularly collecting savings from members. Loans from these cooperative societies are being invested in agriculture, industry, and trade sectors. The details of the cooperative societies in this sub-metropolitan city are mentioned in the table below.
| S.N. | Name of Cooperative Organization | Type | Address |
|---|---|---|---|
| 1 | Adarsh Tol Multipurpose Cooperative Soc. Ltd. | Multipurpose Cooperative | Ward No. 1 |
| 2 | Adarsh Bahumukhi Cooperative Soc. Ltd. | Bahumukhi Cooperative | Ward No. 1 |
| 3 | Triveni Swasthya Sewa Cooperative Soc. Ltd. | Health Service Cooperative | Ward No. 1 |
| 4 | Meherwan Consumer Cooperative Soc. Ltd. | Consumer Cooperative | Ward No. 1 |
| 5 | Indreni Saving and Credit Cooperative Soc. Ltd. | Saving and Credit | Ward No. 1 |
| 6 | Samaj Kalyan Saving and Credit Cooperative Soc. Ltd. | Saving and Credit | Ward No. 1 |
| 7 | Himalayan Saving and Credit Cooperative Soc. Ltd. | Saving and Credit | Ward No. 1 |
| 8 | Om Sai Saving and Credit Cooperative Soc. Ltd. | Saving and Credit | Ward No. 2 |
| 9 | Kuber Savings and Credit Cooperative Ltd. | Savings and Credit | Ward No. 2 |
| 10 | Nepalgunj Saving and Credit Cooperative Soc. Ltd. | Saving and Credit | Ward No. 2 |
| 11 | Panini Saving and Credit Cooperative Soc. Ltd. | Saving and Credit | Ward No. 2 |
| 12 | Prime Saving and Credit Cooperative Soc. Ltd. | Saving and Credit | Ward No. 2 |
| 13 | Mata Bageshwori Saving and Credit Cooperative Soc. Ltd. | Saving and Credit | Ward No. 2 |
| 14 | Krishnasar Agriculture Cooperative Soc. Ltd. | Agriculture Cooperative | Ward No. 2 |
| 15 | Jan-Jagriti Sanchar Cooperative Soc. Ltd. | Communication Cooperative | Ward No. 2 |
| 16 | Nagrik Saving and Credit Cooperative Soc. Ltd. | Saving and Credit | Ward No. 2 |
| 17 | Mega Saving and Credit Cooperative Soc. Ltd. | Saving and Credit | Ward No. 2 |
| 18 | Standard Savings and Credit Cooperative Ltd. | Savings and Credit | Ward No. 2 |
| 19 | Nav Laxmi Saving and Credit Cooperative Soc. Ltd. | Saving and Credit | Ward No. 3 |
| 20 | Siddha Kumakh Multipurpose Cooperative Soc. Ltd. | Multipurpose Cooperative | Ward No. 3 |
| 21 | Grihalaxmi Saving and Credit Cooperative Soc. Ltd. | Saving and Credit | Ward No. 4 |
| 22 | Grihini Multipurpose Cooperative Soc. Ltd. | Multipurpose Cooperative | Ward No. 4 |
| 23 | Jyoti Kunj Saving and Credit Cooperative Soc. Ltd. | Saving and Credit | Ward No. 4 |
| 24 | Taksar Saving and Credit Cooperative Soc. Ltd. | Saving and Credit | Ward No. 4 |
| 25 | Diamond Saving and Credit Cooperative Soc. Ltd. | Saving and Credit | Ward No. 4 |
| 26 | Labh Saving and Credit Cooperative Soc. Ltd. | Saving and Credit | Ward No. 4 |
| 27 | Ujyaalo Saving and Credit Cooperative Soc. Ltd. | Saving and Credit | Ward No. 4 |
| 28 | Chamkilo Tara Saving and Credit Cooperative Soc. Ltd. | Saving and Credit | Ward No. 4 |
| 29 | Chetana Multipurpose Cooperative Soc. Ltd. | Multipurpose Cooperative | Ward No. 4 |
| 30 | Laliguras Saving and Credit Cooperative Soc. Ltd. | Saving and Credit | Ward No. 4 |
| 31 | Sharada Consumer Cooperative Soc. Ltd. | Consumer Cooperative | Ward No. 4 |
| 32 | Sangathit Agriculture Cooperative Soc. Ltd. | Agriculture Cooperative | Ward No. 4 |
| 33 | Civil Savings and Credit Cooperative Ltd. | Savings and Credit | Ward No. 4 |
| 34 | Himshikhar Multipurpose Cooperative Soc. Ltd. | Multipurpose Cooperative | Ward No. 4 |
| 35 | Namuna Multipurpose Cooperative Soc. Ltd. | Multipurpose Cooperative | Ward No. 4 |
| 36 | Danfe Saving and Credit Cooperative Soc. Ltd. | Saving and Credit | Ward No. 5 |
| 37 | Future Saving and Credit Cooperative Soc. Ltd. | Saving and Credit | Ward No. 6 |
| 38 | Shanti Mahila Bikas Multipurpose Cooperative Soc. Ltd. | Multipurpose Cooperative | Ward No. 7 |
| 39 | Gurukul Saving and Credit Cooperative Soc. Ltd. | Saving and Credit | Ward No. 8 |
| 40 | Samanata Saving and Credit Cooperative Soc. Ltd. | Saving and Credit | Ward No. 8 |
| 41 | Arunodaya Saving and Credit Cooperative Soc. Ltd. | Saving and Credit | Ward No. 9 |
| 42 | Balaji Consumer Cooperative Soc. Ltd. | Consumer Cooperative | Ward No. 9 |
| 43 | Jan Utthan Multipurpose Cooperative Soc. Ltd. | Multipurpose | Ward No. 9 |
| 44 | Ramaroshan Saving and Credit Cooperative Soc. Ltd. | Saving and Credit | Ward No. 9 |
| 45 | Rastra Sewak Cooperative Soc. Ltd. | Sewak Cooperative | Ward No. 9 |
| 46 | Sundar Agriculture Cooperative Soc. Ltd. | Agriculture Cooperative | Ward No. 9 |
| 47 | Aashma Saving and Credit Cooperative Soc. Ltd. | Saving and Credit | Ward No. 10 |
| 48 | Udhyog Shramik Saving and Credit Cooperative Soc. Ltd. | Saving and Credit | Ward No. 10 |
| 49 | Global Saving and Credit Cooperative Soc. Ltd. | Saving and Credit | Ward No. 10 |
| 50 | Indravati Saving and Credit Cooperative Soc. Ltd. | Saving and Credit | Ward No. 10 |
| 51 | Shubhalaxmi Multipurpose Cooperative Soc. Ltd. | Multipurpose Cooperative | Ward No. 10 |
| 52 | Navjeevan Saving and Credit Cooperative Soc. Ltd. | Saving and Credit | Ward No. 10 |
| 53 | Samuhik Saving and Credit Cooperative Soc. Ltd. | Saving and Credit | Ward No. 10 |
| 54 | Sungava Swasthya Cooperative Soc. Ltd. | Health Cooperative | Ward No. 10 |
| 55 | Capital Saving and Credit Cooperative Soc. Ltd. | Saving and Credit | Ward No. 11 |
| 56 | Saphal Multipurpose Cooperative Soc. Ltd. | Multipurpose Cooperative | Ward No. 12 |
| 57 | Kalpabrixya Mahila Saving and Credit Cooperative Soc. Ltd. | Saving and Credit | Ward No. 12 |
| 58 | Purnima Multipurpose Cooperative Soc. Ltd. | Multipurpose Cooperative | Ward No. 12 |
| 59 | Madhyapaschim Saving and Credit Cooperative Soc. Ltd. | Saving and Credit | Ward No. 12 |
| 60 | Western Saving and Credit Cooperative Soc. Ltd. | Saving and Credit | Ward No. 12 |
| 61 | Awadh Agriculture Cooperative Soc. Ltd. | Agriculture Cooperative | Ward No. 12 |
| 62 | Unity Saving and Credit Cooperative Soc. Ltd. | Saving and Credit | Ward No. 12 |
| 63 | Hepon Saving and Credit Cooperative Soc. Ltd. | Saving and Credit | Ward No. 12 |
| 64 | Nav Uday Agriculture Cooperative Soc. Ltd. | Agriculture Cooperative | Ward No. 13 |
| 65 | Omkar Agriculture Cooperative Soc. Ltd. | Agriculture Cooperative | Ward No. 13 |
| 66 | Mahendranagar Agriculture Cooperative Soc. Ltd. | Agriculture Cooperative | Ward No. 14 |
| 67 | Srijana Mahila Bikas Multipurpose Cooperative Soc. Ltd. | Multipurpose Cooperative | Ward No. 14 |
| 68 | Suryodaya Aalu Utpadan Cooperative Soc. Ltd. | Agriculture Cooperative | Ward No. 14 |
| 69 | Muskan Agriculture Cooperative Soc. Ltd. | Agriculture Cooperative | Ward No. 15 |
| 70 | Hanuman Krishak Cooperative Soc. Ltd. | Agriculture Cooperative | Ward No. 15 |
| 71 | Jai Kisan Cooperative Soc. Ltd. | Agriculture Cooperative | Ward No. 15 |
| 72 | Raja Consumer Cooperative Soc. Ltd. | Consumer Cooperative | Ward No. 16 |
| 73 | Mahtab Multipurpose Cooperative Soc. Ltd. | Multipurpose Cooperative | Ward No. 16 |
| 74 | Jagriti Mahila Multipurpose Cooperative Soc. Ltd. | Multipurpose Cooperative | Ward No. 16 |
| 75 | Unnati Multipurpose Cooperative Soc. Ltd. | Multipurpose Cooperative | Ward No. 17 |
| 76 | Gausulwara Agriculture Cooperative Soc. Ltd. | Agriculture Cooperative | Ward No. 17 |
| 77 | Cheitanshil Agriculture Cooperative Soc. Ltd. | Agriculture Cooperative | Ward No. 17 |
| 78 | Jai Ma Bhawani Agriculture Cooperative Soc. Ltd. | Agriculture Cooperative | Ward No. 17 |
| 79 | Jai Maa Jwala Krishak Cooperative Soc. Ltd. | Agriculture Cooperative | Ward No. 17 |
| 80 | Jai Maa Durga Agriculture Cooperative Soc. Ltd. | Agriculture Cooperative | Ward No. 17 |
| 81 | Mahakali Agriculture Cooperative Soc. Ltd. | Agriculture Cooperative | Ward No. 17 |
| 82 | Lavkush Agriculture Cooperative Soc. Ltd. | Agriculture Cooperative | Ward No. 17 |
| 83 | Sadbhav Saving and Credit Cooperative Soc. Ltd. | Saving and Credit | Ward No. 17 |
| 84 | Samaj Utthan Agriculture Cooperative Soc. Ltd. | Agriculture Cooperative | Ward No. 17 |
| 85 | Jai Prithvi Agriculture Cooperative Soc. Ltd. | Agriculture Cooperative | Ward No. 18 |
| 86 | Udyamshilta Saving and Credit Cooperative Soc. Ltd. | Saving and Credit | Ward No. 18 |
| 87 | Phulteka Multipurpose Cooperative Soc. Ltd. | Multipurpose Cooperative | Ward No. 18 |
| 88 | Pashupati Multipurpose Cooperative Soc. Ltd. | Multipurpose Cooperative | Ward No. 18 |
| 89 | Sahara Saving and Credit Cooperative Soc. Ltd. | Saving and Credit | Ward No. 18 |
| 90 | Chhana Agriculture Cooperative Soc. Ltd. | Agriculture Cooperative | Ward No. 18 |
| 91 | Radha Krishna Agriculture Cooperative Soc. Ltd. | Agriculture Cooperative | Ward No. 19 |
| 92 | Bagwan Agriculture Cooperative Soc. Ltd. | Agriculture Cooperative | Ward No. 19 |
| 93 | Aalanagar Mahila Agriculture Cooperative Soc. Ltd. | Women Agriculture Cooperative | Ward No. 19 |
| 94 | Agragami Mahila Saving and Credit Cooperative Soc. Ltd. | Saving and Credit | Ward No. 20 |
| 95 | Kamaldas Baba Agriculture Cooperative Soc. Ltd. | Agriculture Cooperative | Ward No. 20 |
| 96 | Makhmali Mahila Bikas Multipurpose Cooperative Soc. Ltd. | Multipurpose Cooperative | Ward No. 20 |
| 97 | Shuddha Goras Dugdha Utpadak Cooperative Soc. Ltd. | Agriculture Cooperative | Ward No. 20 |
| 98 | Santoshi Mata Agriculture Cooperative Soc. Ltd. | Agriculture Cooperative | Ward No. 20 |
| 99 | Siddha Baba Agriculture Cooperative Soc. Ltd. | Agriculture Cooperative | Ward No. 20 |
| 100 | Shree Sworojgar Agriculture Cooperative Soc. Ltd. | Agriculture Cooperative | Ward No. 20 |
| 101 | Hamro Shivil Agriculture Cooperative Soc. Ltd. | Agriculture Cooperative | Ward No. 20 |
| 102 | Jamuna Agriculture Cooperative Soc. Ltd. | Agriculture Cooperative | Ward No. 21 |
| 103 | Sifa Agriculture Cooperative Soc. Ltd. | Agriculture Cooperative | Ward No. 21 |
| 104 | Naharpruwa Agriculture Cooperative Soc. Ltd. | Agriculture Cooperative | Ward No. 22 |
| 105 | Sana Kisan Agriculture Cooperative Soc. Ltd. | Agriculture Cooperative | Ward No. 22 |
| 106 | Kopila Mahila Agriculture Cooperative Soc. Ltd. | Agriculture Cooperative | Ward No. 22 |
| 107 | Kanti Pokhari Agriculture Cooperative Soc. Ltd. | Agriculture Cooperative | Ward No. 22 |
| 108 | Shree Jai Gurudev Consumer Cooperative Soc. Ltd. | Consumer Cooperative | Ward No. 22 |
| 109 | Kisan Agriculture Cooperative Soc. Ltd. | Agriculture Cooperative | Ward No. 23 |
| 110 | Bahumukhi Saxa Cooperative Soc. Ltd. | Bahumukhi Saxa Cooperative | |
| 111 | Banke Unesco Agriculture Cooperative Soc. Ltd. | Agriculture Cooperative |