Physical Infrastructure Development
Transportation, electricity, communication, and housing
7.1 Transportation Infrastructure
7.1.1 Current Road Network Status
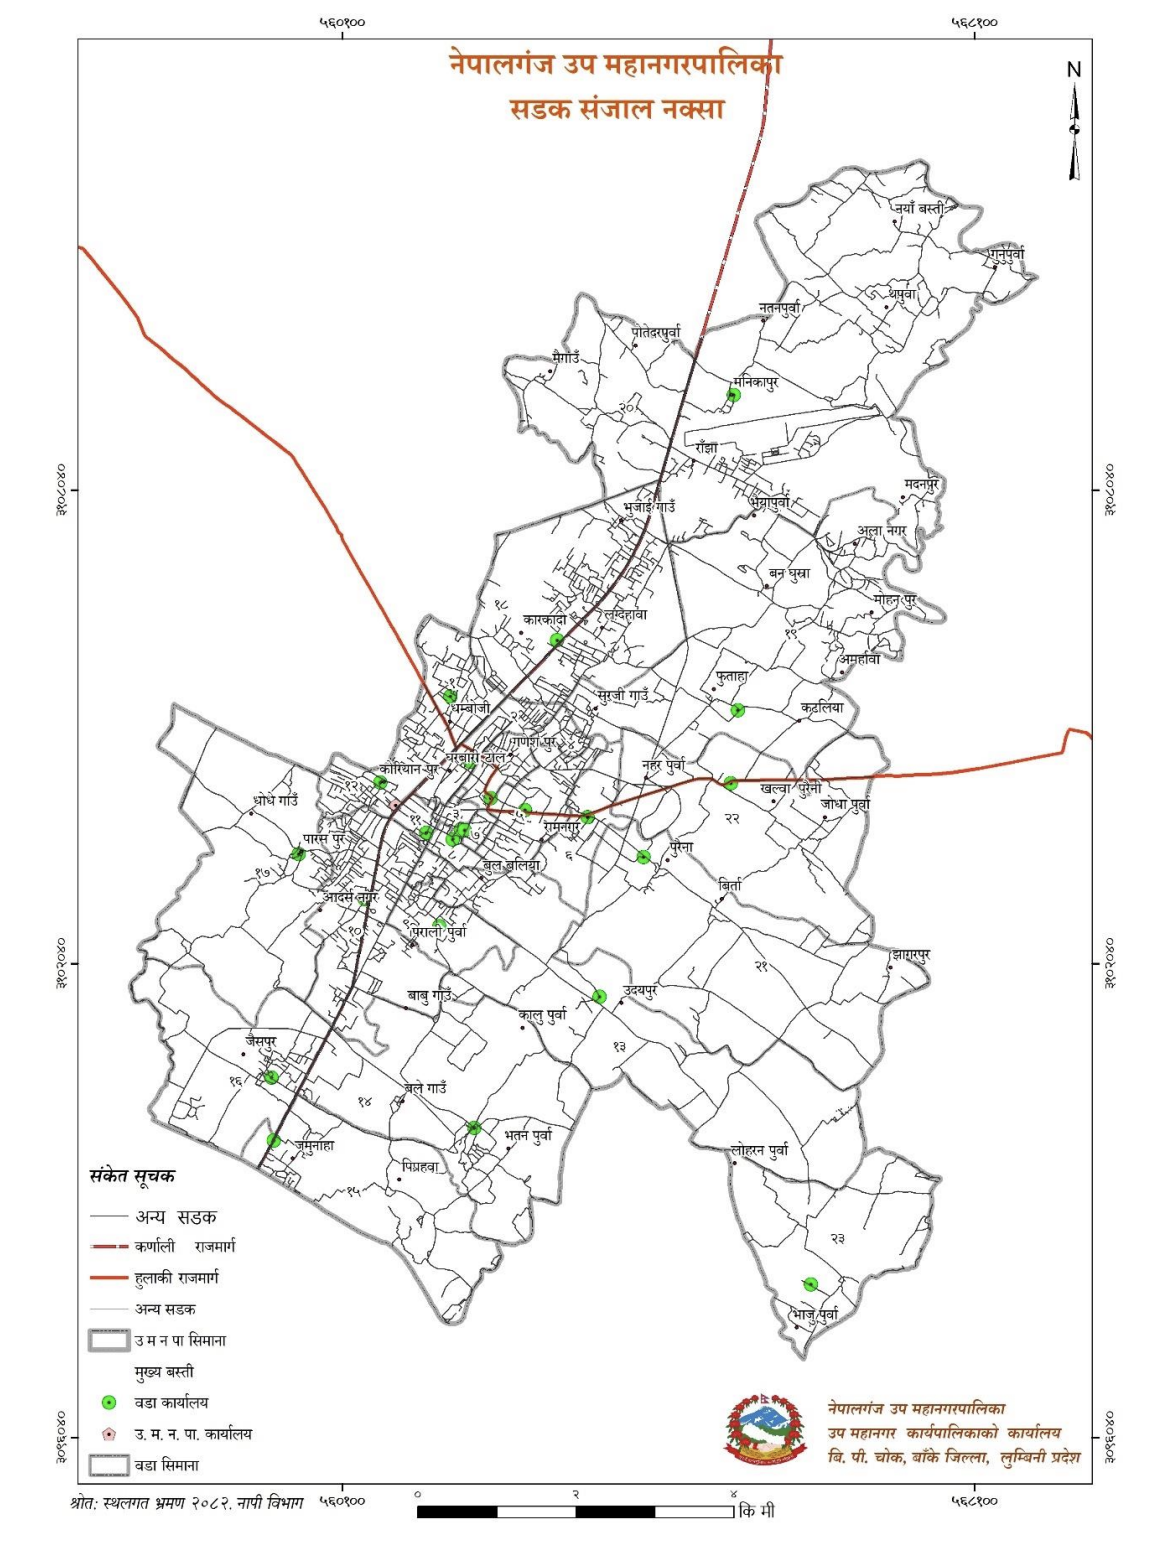
Map No. 2: Road Network Map of Sub-Metropolitan City
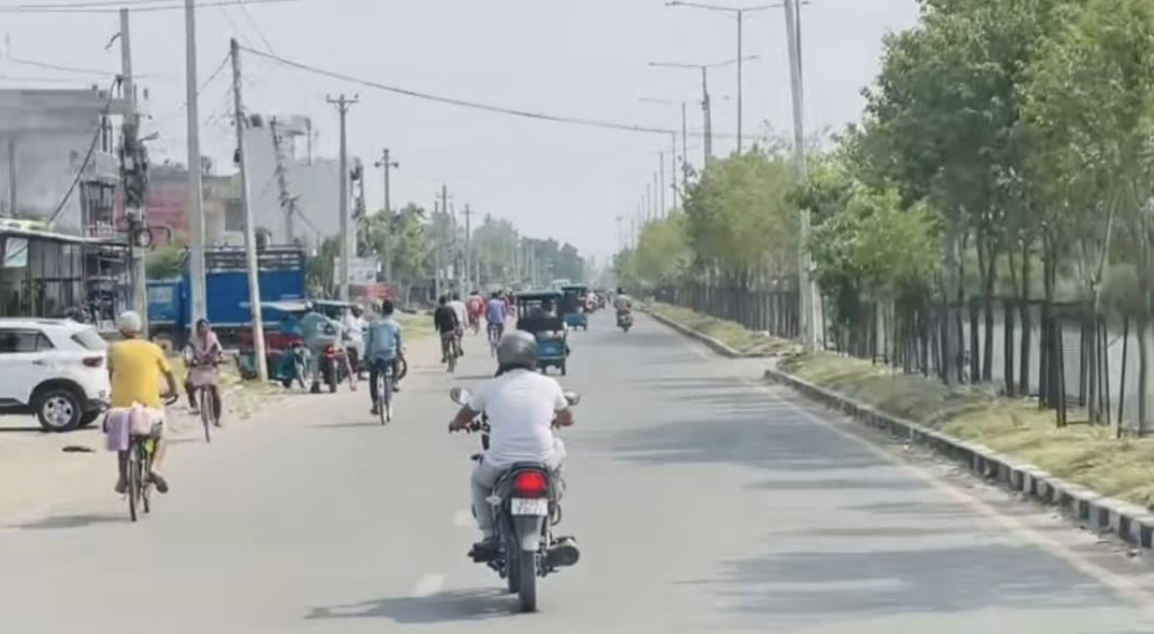
Rupanihiya Road
Road network is the primary prerequisite for physical development of any place. The door of overall development opens with the development of fully equipped road transportation. At the local level, it is necessary to connect ward centers with the city center and the city center to the national highway system through district roads. In urban settlements, agricultural products can be marketed through the development and upgrading of agricultural roads, thereby strengthening the economic condition of the people. Economic revolution is possible through the development of industries and tourism sector via well-equipped road networks. In addition, internal and external tourists can be attracted by providing access to religious areas through road networks.
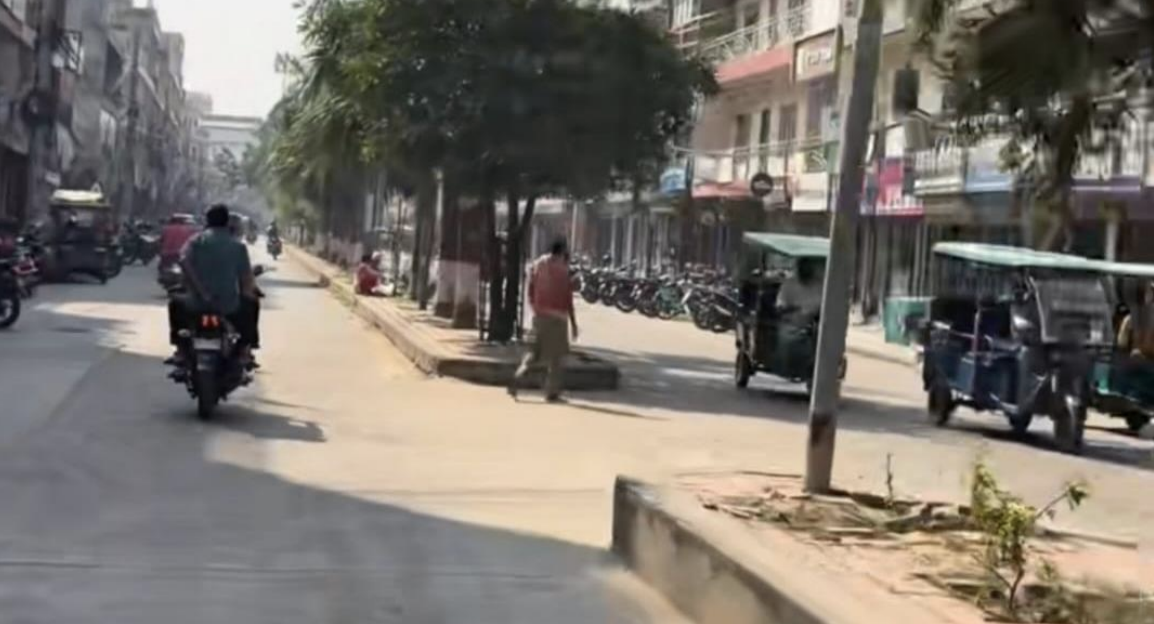
New Road
Until the mapping work of 2050 BS, the road condition in hilly areas of Nepal was quite weak. However, after the political change of 2046, as per the practice of allocating funds from the national treasury to local bodies, road expansion work gained momentum in rural areas as well. Subsequently, rural areas have also made significant progress in road network expansion. However, due to difficult hilly terrain, mapping of some such local structures could not be done and in the absence of factual information, it is not possible to confirm how much road network expansion has taken place in those areas. In this context, the concept of Municipality Transport Master Plan (MTMP) was established to systematically manage transportation networks based on maps and data of each municipality/area's transportation network. Accordingly, the road transportation master plan has been formulated and implemented in this sub-metropolitan city as well.
For air transportation in this sub-metropolitan city, daily domestic flights operate from Nepalgunj Airport. In addition, national highways such as Surkhet Road (Ratna Highway), Khajura Road (Nepalgunj-Guleria Road), Airport Road (Sanpha-Airport), Bus Park Road, and Postal Highway (Nepalgunj-Baghauda Road) are the main road transportation routes. According to the data obtained from the transportation master plan of the sub-metropolitan city, there are 41 Class A roads, 96 Class B roads, and 139 Class C roads in operation. Similarly, there are 26 bridges and 62 culverts of various sizes in operation within the municipality. Road and transportation development helps increase productivity, provide access to health and education services, create employment, reduce poverty, and support economic and social development. The sub-metropolitan city needs to take necessary steps to improve road and transportation conditions.
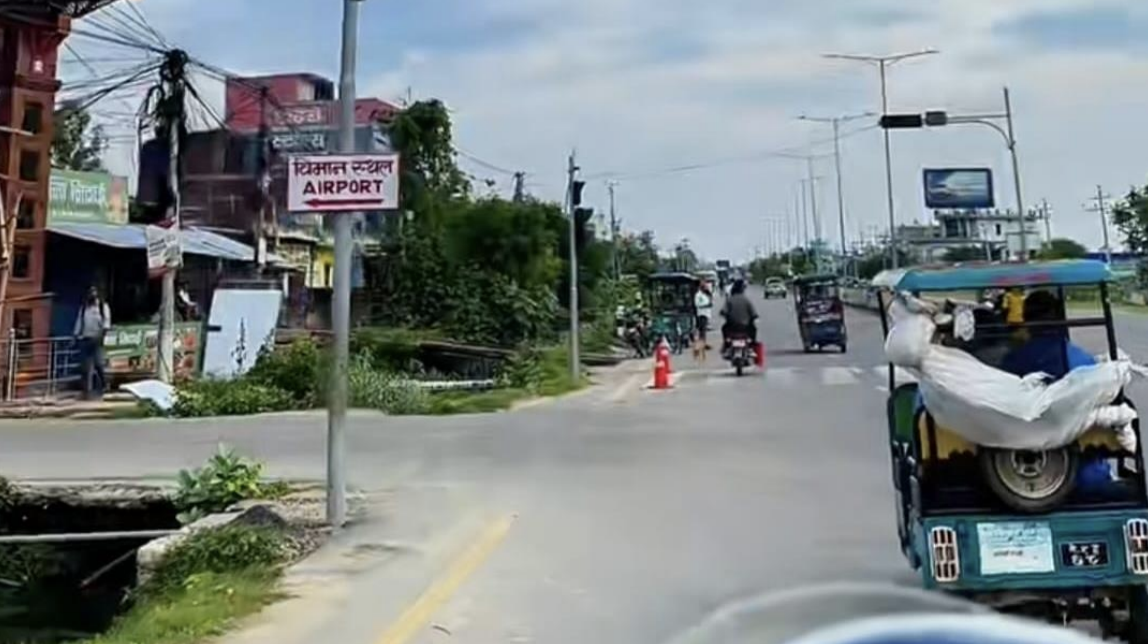
Nepalgunj Airport
Development of routes is essential to make public transportation easy, effective, affordable, and regular for establishing mutual contact between people living in different places and geographical areas. When transportation services come into operation on different routes, it connects different communities and areas together, establishing a sense of unity among the people.
7.1.2 Vehicles in Sub-Metropolitan City Area
Currently in Nepal's urban areas and market centers, long-distance buses, minibuses, Hiace vans, and micro buses are found in operation under road transportation, while for short distances, microbuses, motorcycles, rickshaws, bicycles, tempos, Tata vehicles and similar modes of transport are available. Among these vehicles, some are private and some are public.
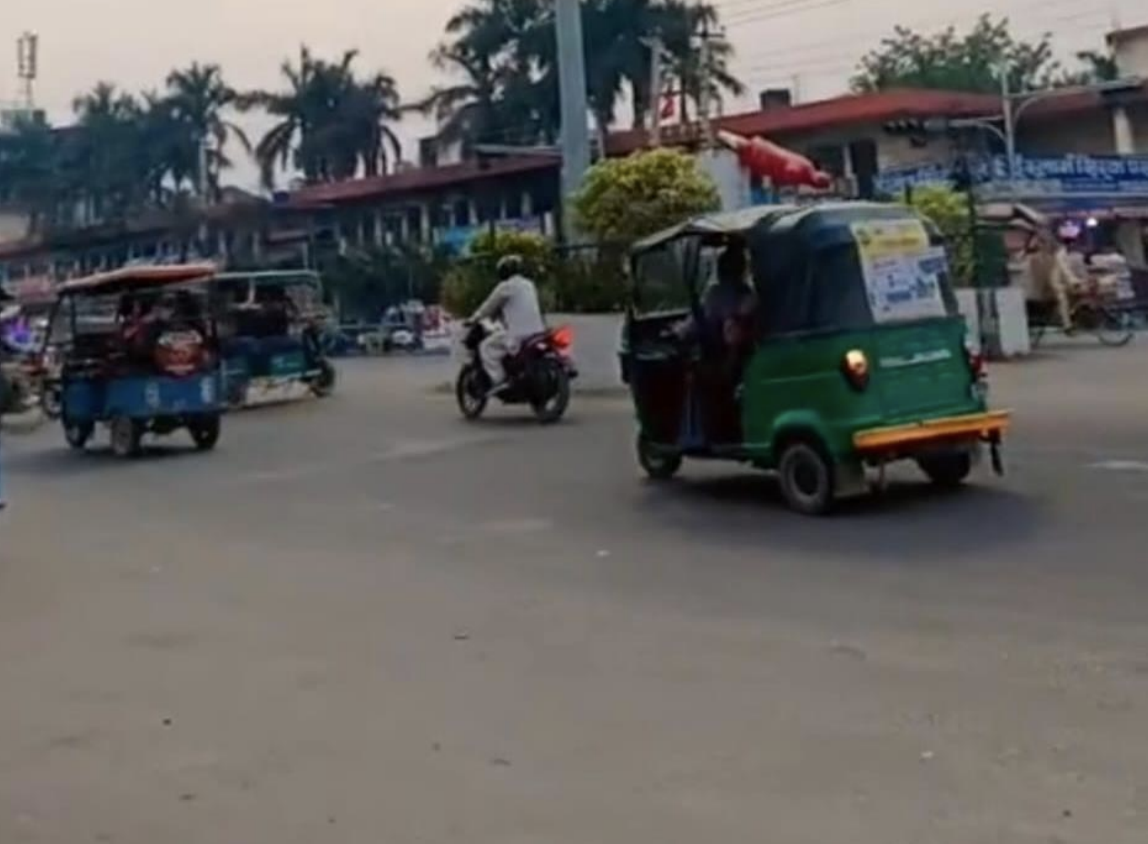
Vehicles operating in the Sub-Metropolitan City
Transportation serves as an important infrastructure for making the economic and social development of any area dynamic, simplifying the flow of public goods and services, and developing the agricultural and non-agricultural sectors. In this sub-metropolitan city, trucks, tractors, jeeps, buses, motorcycles, rickshaws, tangas, bicycles, and DV vehicles are mainly used. All roads of the sub-metropolitan city need to be upgraded to be operational throughout the twelve months of the year. Additionally, various infrastructure required for road transportation such as vehicle parking areas, bus stops, passenger waiting areas, street lights, road signs, and bus terminal facilities need to be systematically developed.
7.1.3 Bus Park and Bus Stop Description
Bus parks equipped with facilities such as electricity, water, passenger waiting areas, toilets, and public mobile charging stations can be constructed to make public movement convenient. Looking at the practices of developed countries, bus parks are found to have proper arrangements for help desks and peace and security. When well-equipped and secure bus parks are constructed, the quality of transportation service increases. Structures built in bus parks must be disability-friendly. In this sub-metropolitan city, although bus parks and bus stops exist, they have not been properly organized. Similarly, the main market areas of the sub-metropolitan city serve as bus stops. There is a lack of passenger waiting areas and toilets here.
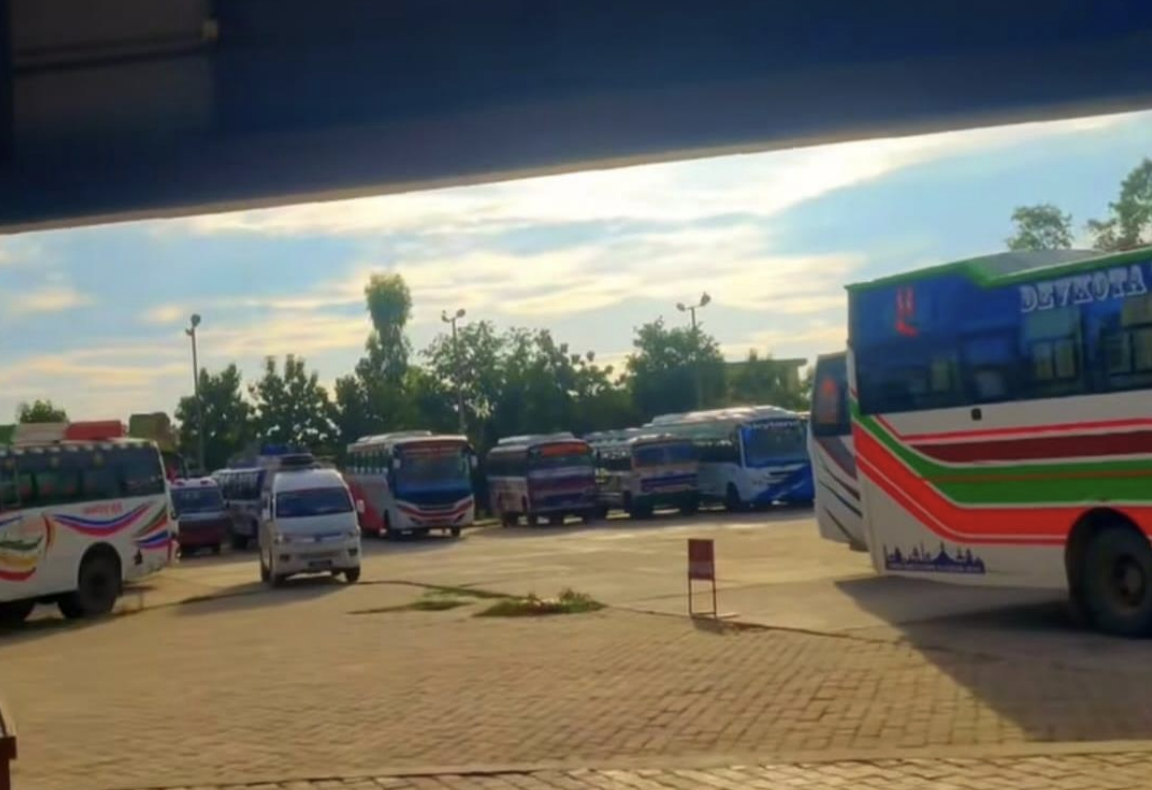
Nepalgunj Bus Park
7.1.4 Suspension Bridge and Culverts
According to data, this metropolitan city has 1 motorable bridge and 2 suspension bridges. The detailed description is presented in the table below.
| S.N. | Name of Motor/Suspension Bridge | Ward No. | Remarks |
|---|---|---|---|
| 1 | Nayabasti Ganapur Suspension Bridge | 20 | |
| 2 | Sano Nepal Alanagar Suspension Bridge | 20 | |
| 3 | Dhudhuwa Khola Permanent Bridge | 20 |
7.2 Electricity and Alternative Energy
Although all wards of the sub-metropolitan city have access to electrification, the electricity capacity remains low due to the increasing population and needs to be enhanced. To improve peace and security, solar streetlights and CCTV cameras need to be installed on the roads. However, extensive work is required for the strengthening of transmission lines. In terms of improving electricity transmission lines, wooden poles must first be replaced with concrete or iron poles, and transformers need to be installed in areas with low voltage.
Apart from electricity services, solid programs should be run to promote alternative and renewable energy. Encouraging and providing subsidies for the construction of biogas in animal husbandry areas, and installing solar energy in both remote and accessible areas, can ensure a regular supply of energy and boost further development activities through efficient energy utilization. Solar energy can also be used for lift irrigation and drinking water projects, and surplus energy generated for domestic consumption can even be sold to the national grid.
Generally, an average family consumes 2 kilowatts of electricity daily. Even this consumption rate is lower in rural areas. A solar panel of 17.6 square feet produces 250 watts of electricity. Approximately 6.8 hours of sunlight per day (250 watts x 6.8 hours) yields 1.7 kilowatts of electricity. Producing 1.7 kilowatts x 30 days can generate 51 kilowatts of electricity per month.
This means from a house occupying 600 square feet:
51 kW x 600 / 17.6 = 1738 kW
This implies that by installing solar energy in a house covering 600 square feet, the required energy for that house can be produced. However, rural houses need to be made solar energy-friendly. On the other hand, small hydropower projects can be operated by studying the potential of perennial water sources and reservoir-based electricity. Surplus electricity generated this way can be sold to the national grid.
Until now, many households still use wood/firewood as their primary cooking fuel. Electricity and solar energy can help replace wood/firewood. This also contributes to environmental conservation. Therefore, it is necessary to conduct programs for the maintenance and improvement of electricity transmission lines, installation of transformers, and promotion of alternative and renewable energy in various wards of the sub-metropolitan city.
7.2.1 Fuel Usage Details (Households Based on Cooking Fuel)
| Ward | Wood, Firewood, Coal | LP Gas | Electricity | Cow Dung (Guitha) | Bio Gas | Kerosene | Others | Total |
|---|---|---|---|---|---|---|---|---|
| 1 | 99 | 1843 | 9 | 0 | 206 | 10 | 0 | 2167 |
| 2 | 55 | 1305 | 2 | 1 | 0 | 0 | 0 | 1363 |
| 3 | 28 | 525 | 1 | 1 | 1 | 0 | 0 | 556 |
| 4 | 108 | 2782 | 14 | 0 | 1 | 0 | 13 | 2918 |
| 5 | 63 | 1047 | 25 | 2 | 0 | 0 | 0 | 1137 |
| 6 | 102 | 1304 | 4 | 0 | 1 | 0 | 0 | 1411 |
| 7 | 6 | 671 | 0 | 0 | 3 | 0 | 2 | 682 |
| 8 | 36 | 811 | 5 | 0 | 0 | 0 | 0 | 852 |
| 9 | 115 | 1296 | 13 | 0 | 1 | 0 | 0 | 1425 |
| 10 | 106 | 2538 | 11 | 1 | 4 | 0 | 3 | 2663 |
| 11 | 52 | 946 | 0 | 1 | 2 | 0 | 0 | 1001 |
| 12 | 114 | 1616 | 5 | 2 | 1 | 0 | 0 | 1738 |
| 13 | 382 | 1082 | 0 | 0 | 1 | 1 | 0 | 1466 |
| 14 | 557 | 498 | 0 | 0 | 1 | 0 | 0 | 1056 |
| 15 | 579 | 552 | 4 | 7 | 0 | 3 | 0 | 1145 |
| 16 | 336 | 757 | 3 | 0 | 3 | 1 | 0 | 1100 |
| 17 | 436 | 778 | 3 | 1 | 2 | 0 | 0 | 1220 |
| 18 | 299 | 2386 | 15 | 1 | 1 | 0 | 0 | 2702 |
| 19 | 709 | 988 | 11 | 0 | 3 | 0 | 0 | 1711 |
| 20 | 1188 | 2073 | 16 | 1 | 17 | 1 | 2 | 3298 |
| 21 | 910 | 629 | 12 | 0 | 2 | 0 | 0 | 1553 |
| 22 | 620 | 440 | 4 | 1 | 1 | 0 | 0 | 1066 |
| 23 | 300 | 32 | 0 | 1 | 0 | 0 | 2 | 335 |
| Total | 7200 | 26899 | 157 | 20 | 251 | 16 | 22 | 34565 |
| Percentage | 20.83 | 77.82 | 0.45 | 0.06 | 0.73 | 0.05 | 0.06 | 100 |
Despite being a country rich in water resources, Nepal faces an energy crisis in both urban and rural areas due to the inability to utilize these resources effectively. In the hilly and mountainous regions of Nepal, a large number of people still use wood/firewood/coal as cooking fuel, while the use of guitha (dried cow dung) is widespread in the Terai region.
Among the total households in this Nepalgunj Sub-Metropolitan City, 7,200 (20.83%) use wood/firewood/coal for cooking, while the majority, 26,899 (77.82%), use LP gas. Similarly, the number of families using electricity is 157 (0.45%), kerosene is 16 (0.05%), and bio gas is 251 (0.73%). Additionally, 20 households (0.06%) use guitha, and 22 households (0.06%) use other fuel sources. Detailed information is presented in the table.
Main Cooking Fuel Usage Distribution
Main Cooking Fuel Usage Distribution
Tap bars or slices to view details
According to the concept of sustainable development, it is essential to change human consumption patterns to maintain environmental balance. For example, Nepal aims to reduce the population using wood, firewood, cow dung, etc., as the primary source of fuel from 74.7% in the base year 2015 to 30% by 2030 (SDG-7), and increase the use of LP gas for cooking from 18% (2015) to 33%. Embracing this national goal, it is necessary to orient the policies and programs of this Sub-Metropolitan City towards it.
7.2.2 Households by Main Source of Lighting Fuel
The Nepal Electricity Authority (NEA) has been implementing plans for electricity maintenance, revenue collection, and electrification in all wards of this Sub-Metropolitan City. According to the National Census, 2021 (BS 2078), electricity appears to be the primary source of fuel used for lighting daily.
| Ward | Electricity | Solar | Kerosene | Bio Gas | Others | Total |
|---|---|---|---|---|---|---|
| 1 | 2108 | 54 | 3 | 0 | 2 | 2167 |
| 2 | 1356 | 6 | 0 | 0 | 1 | 1363 |
| 3 | 537 | 18 | 0 | 0 | 1 | 556 |
| 4 | 2874 | 27 | 1 | 0 | 16 | 2918 |
| 5 | 1112 | 20 | 5 | 0 | 0 | 1137 |
| 6 | 1382 | 14 | 11 | 1 | 3 | 1411 |
| 7 | 671 | 8 | 3 | 0 | 0 | 682 |
| 8 | 848 | 2 | 2 | 0 | 0 | 852 |
| 9 | 1418 | 5 | 1 | 0 | 1 | 1425 |
| 10 | 2644 | 13 | 1 | 0 | 5 | 2663 |
| 11 | 996 | 3 | 0 | 0 | 2 | 1001 |
| 12 | 1718 | 17 | 2 | 0 | 1 | 1738 |
| 13 | 1410 | 21 | 8 | 1 | 26 | 1466 |
| 14 | 1001 | 16 | 36 | 1 | 2 | 1056 |
| 15 | 980 | 8 | 146 | 5 | 6 | 1145 |
| 16 | 1064 | 10 | 24 | 1 | 1 | 1100 |
| 17 | 1182 | 21 | 16 | 0 | 1 | 1220 |
| 18 | 2681 | 16 | 2 | 0 | 3 | 2702 |
| 19 | 1651 | 11 | 37 | 3 | 9 | 1711 |
| 20 | 3214 | 31 | 46 | 3 | 4 | 3298 |
| 21 | 1484 | 8 | 49 | 3 | 9 | 1553 |
| 22 | 951 | 6 | 5 | 2 | 102 | 1066 |
| 23 | 302 | 2 | 19 | 0 | 12 | 335 |
| Total | 33584 | 345 | 417 | 20 | 199 | 34565 |
| Percentage | 97.16 | 1.00 | 1.21 | 0.06 | 0.58 | 100 |
Analyzing the source of fuel used by households for daily lighting in the Sub-Metropolitan City, it was found that out of a total of 34,565 households, 33,584 (97.16%) use electricity, 345 (1.00%) use solar, 417 (1.21%) use kerosene, 20 (0.06%) use bio gas, and 199 (0.58%) use other fuel sources. Detailed ward-wise information is presented in the table.
Details of Fuel Used for Daily Lighting
Details of Fuel Used for Daily Lighting
Tap bars or slices to view details
7.2.3 Households Using Alternative Energy
Increasing the use of renewable alternative energy while reducing dependence on petroleum products helps maintain environmental balance. Since products like diesel, petrol, and kerosene are not produced in Nepal, billions of rupees are spent annually on importing them. For a landlocked developing third-world country like Nepal, this is a major cause of trade deficit. In the context of our inability to effectively implement import substitution and export management policies, we can become self-reliant in energy sources through the development of wind energy, solar energy, hydro energy, and bio gas. Therefore, in Nepal's case, local, provincial, and federal governments must formulate necessary policies and work on the development of renewable alternative energy.
7.3 Communication and Technology
The globalized society of the 21st century is in the era of information and communication. While urban areas in Nepal have largely embraced the revolution in information and communication, rural areas still lack full expansion of television, newspapers, internet, telephone, mobile, and courier services. Developing these media of communication and technology to bring rural populations into the world of information and communication remains a challenge. The Constitution of Nepal defines the people's right to information as a fundamental right. The details of communication and technology available in Nepalgunj Sub-Metropolitan City are as follows. Communication media operate via NCELL and NTC, and internet services have expanded through various internet companies. Currently, the Sub-Metropolitan City has introduced policies and programs to make service delivery information and technology-friendly, integrate all currently used software into a single organized web portal, install CCTV cameras in high-traffic areas, and conduct activities like capacity development training, workshops, orientations, and writing improvement for local media and journalists. Radio, FM, and communication media in the Sub-Metropolitan City are presented in the table below.
7.3.1 Details of Radio, FM and Communication Media in the Sub-Metropolitan City
| S.N. | Entity | Station Manager | Contact Number |
|---|---|---|---|
| 1 | Bageshwari FM | Shukrarishi Chaulagai | 9858024709 |
| 2 | Krishnasar FM | Tula Adhikari | 9851074280 |
| 3 | Rubaru FM | Shakil Ahmed Qadri | 9858066768 |
| 4 | Radio Sadbhav FM | Navin Giri | 9848082228 |
| 5 | Radio Morning Star FM | Datta Dhital | 9858020842 |
| 6 | Radio Hatemalo FM | Dilli B.C. | 9858021099 |
| 7 | Bheri FM | Arif Ansari | 9858023997 |
| 8 | Nepal Television Correspondent | Rudra Subedi | 9858021181 |
| 9 | Kantipur Television Correspondent | J. Pandey, Sabita G.C. | 9858020565 |
| 10 | Kantipur Daily Correspondent | Rupa Gahatraj | 9848027792 |
| 11 | Image Television Correspondent | Narendra Thapa | 9848023663 |
| 12 | Himalaya Television Correspondent | Krishna Adhikari | 9858023161 |
| 13 | News 24 Television Correspondent | Krishna Khanal | 9851021088 |
| 14 | Avenues Television Correspondent | Durga Rokaya | 9858023665 |
| 15 | Bageshwari Television Correspondent | Priyasmriti Dhakal | 9848152324 |
| 16 | Kohalpur Television Correspondent | Rudra Subedi | 9858021181 |
| 17 | Rastriya Samachar Samiti | Yuv Raj Pandey | 9857025057 |
| 18 | Gorkhapatra/Kalprishtha Daily Editor | Kamal Khatri | 9851148361 |
| 19 | Dainik Nepalgunj Correspondent | Jhalak Gaire | 9858020711 |
| 20 | Mission Today | Binod Paudel | 9858023069 |
| 21 | Naya Patrika Daily Correspondent | Bishwaraj Pachhaldawa | 9848032299 |
| 22 | AP1 Television Correspondent | Laxman Dhungana | 9858024565 |
| 23 | BBC Nepali Service | Bimala Chaudhary | 9848002213 |
7.3.2 Details on Access to Modern Facilities
| Ward No. | No Facility | At Least One Facility | Radio | Television | Landline | Mobile (Basic) | Smart Mobile | Computer/Laptop | Internet | Car/Jeep/Van | Motorcycle | Bicycle | Electric Fan | Refrigerator | Washing Machine | AC |
|---|---|---|---|---|---|---|---|---|---|---|---|---|---|---|---|---|
| 1 | 42 | 2125 | 866 | 1377 | 110 | 1500 | 1886 | 544 | 1368 | 82 | 911 | 1045 | 1884 | 1099 | 172 | 132 |
| 2 | 34 | 1329 | 536 | 1045 | 213 | 1017 | 1201 | 410 | 1043 | 100 | 735 | 559 | 1223 | 778 | 170 | 123 |
| 3 | 11 | 545 | 192 | 377 | 67 | 341 | 420 | 100 | 258 | 8 | 272 | 271 | 451 | 300 | 130 | 73 |
| 4 | 39 | 2879 | 1204 | 1823 | 235 | 2023 | 2552 | 833 | 2031 | 161 | 1283 | 974 | 2402 | 1764 | 266 | 222 |
| 5 | 31 | 1106 | 164 | 744 | 59 | 798 | 929 | 144 | 333 | 27 | 430 | 696 | 945 | 423 | 85 | 72 |
| 6 | 29 | 1382 | 357 | 866 | 70 | 927 | 1136 | 222 | 775 | 36 | 610 | 778 | 1270 | 640 | 48 | 42 |
| 7 | 3 | 679 | 227 | 509 | 42 | 284 | 518 | 67 | 303 | 7 | 279 | 385 | 637 | 356 | 67 | 48 |
| 8 | 28 | 824 | 65 | 631 | 11 | 543 | 718 | 96 | 365 | 11 | 426 | 606 | 792 | 503 | 102 | 44 |
| 9 | 24 | 1401 | 784 | 831 | 149 | 831 | 1169 | 334 | 900 | 28 | 539 | 751 | 1314 | 651 | 37 | 32 |
| 10 | 19 | 2644 | 1733 | 1619 | 439 | 1485 | 2429 | 1013 | 2052 | 183 | 1232 | 958 | 2412 | 1392 | 317 | 208 |
| 11 | 5 | 996 | 629 | 825 | 234 | 727 | 865 | 189 | 716 | 37 | 433 | 591 | 917 | 603 | 160 | 87 |
| 12 | 35 | 1703 | 556 | 1152 | 172 | 982 | 1462 | 484 | 1144 | 71 | 759 | 776 | 1545 | 1011 | 140 | 112 |
| 13 | 105 | 1361 | 369 | 648 | 162 | 796 | 911 | 234 | 372 | 48 | 472 | 913 | 1025 | 359 | 62 | 42 |
| 14 | 43 | 1013 | 17 | 275 | 3 | 556 | 457 | 21 | 88 | 4 | 175 | 911 | 876 | 121 | 6 | 2 |
| 15 | 78 | 1067 | 13 | 378 | 3 | 570 | 627 | 20 | 69 | 4 | 245 | 677 | 831 | 134 | 30 | 10 |
| 16 | 30 | 1070 | 361 | 471 | 7 | 807 | 725 | 37 | 103 | 11 | 292 | 911 | 974 | 261 | 74 | 14 |
| 17 | 53 | 1167 | 587 | 701 | 54 | 860 | 825 | 152 | 522 | 40 | 396 | 922 | 996 | 265 | 40 | 19 |
| 18 | 153 | 2549 | 760 | 1797 | 236 | 1516 | 2142 | 872 | 1641 | 154 | 1382 | 1245 | 2234 | 1491 | 150 | 124 |
| 19 | 65 | 1646 | 82 | 911 | 29 | 1053 | 1166 | 138 | 531 | 32 | 596 | 1269 | 1494 | 594 | 38 | 13 |
| 20 | 165 | 3133 | 322 | 1649 | 90 | 2350 | 2047 | 316 | 1163 | 55 | 908 | 1667 | 2612 | 852 | 39 | 32 |
| 21 | 84 | 1469 | 99 | 388 | 15 | 882 | 680 | 56 | 269 | 9 | 298 | 1337 | 1249 | 166 | 8 | 9 |
| 22 | 80 | 986 | 50 | 414 | 16 | 716 | 518 | 51 | 216 | 10 | 211 | 888 | 813 | 221 | 11 | 9 |
| 23 | 14 | 321 | 5 | 68 | 0 | 198 | 144 | 6 | 73 | 3 | 84 | 282 | 259 | 55 | 7 | 1 |
| Total | 1170 | 33395 | 9978 | 19539 | 2576 | 21842 | 25535 | 6347 | 16335 | 1129 | 13049 | 19412 | 29155 | 14247 | 2181 | 1470 |
Based on resources and service facilities, it appears that the number of households with at least one facility in the Sub-Metropolitan City is 33,395. Among the total households, 29,155 households have electric fans, and 25,535 households have smart mobile phones. Similarly, the number of families with basic mobile phones is 21,842. The number of families with radio facilities is 9,978, while 19,539 families have televisions.
Overall, the data shows an increase in mobile services in the communication sector, while internet services are also in the process of expansion. Since mobile users can easily perform many tasks such as audio, video, information, music, and news exchange, the number of television and radio users is decreasing compared to mobile users. Due to the geographical condition, being entirely in the Terai region and flat land, the number of people using high-facility items like cars/jeeps, air conditioners, heaters, or gas geysers is increasing. Detailed ward-wise information is presented in the table.
Details of Resources and Facilities in the Family
Details of Resources and Facilities in the Family
Tap bars or slices to view details
7.4 Housing and Buildings
The Sub-Metropolitan City has settlements with mixed population density. In terms of establishing settlements, there is a tradition of living scattered in potential market areas, water-available zones, cultivable areas, and locations suitable for animal husbandry and food production. Consequently, settlements are thick in some wards and thin in others. Most houses here are permanent (pakki) or semi-permanent (ardha-pakki), making the houses in this Sub-Metropolitan City relatively safe and risk-free from earthquakes and other disasters from a security perspective.
7.4.1 Households Based on Type of Roof
| Ward | Zinc/Tin | Cement/Concrete | Thatch/Straw | Tiles | Stone/Slate | Wood/Plank | Others | Total |
|---|---|---|---|---|---|---|---|---|
| 1 | 157 | 1940 | 9 | 10 | 48 | 3 | 0 | 2167 |
| 2 | 119 | 1208 | 4 | 10 | 17 | 3 | 2 | 1363 |
| 3 | 71 | 475 | 2 | 3 | 4 | 1 | 0 | 556 |
| 4 | 232 | 2624 | 5 | 4 | 14 | 17 | 22 | 2918 |
| 5 | 170 | 954 | 2 | 8 | 2 | 1 | 0 | 1137 |
| 6 | 218 | 1126 | 14 | 44 | 5 | 1 | 3 | 1411 |
| 7 | 59 | 602 | 3 | 9 | 2 | 7 | 0 | 682 |
| 8 | 84 | 746 | 10 | 1 | 8 | 2 | 1 | 852 |
| 9 | 92 | 1253 | 11 | 65 | 2 | 2 | 0 | 1425 |
| 10 | 127 | 2496 | 14 | 11 | 5 | 6 | 5 | 2663 |
| 11 | 121 | 851 | 9 | 0 | 9 | 11 | 0 | 1001 |
| 12 | 174 | 1532 | 6 | 19 | 6 | 0 | 1 | 1738 |
| 13 | 460 | 885 | 32 | 83 | 3 | 3 | 0 | 1466 |
| 14 | 396 | 475 | 62 | 120 | 2 | 0 | 1 | 1056 |
| 15 | 349 | 527 | 85 | 175 | 4 | 2 | 3 | 1145 |
| 16 | 324 | 712 | 16 | 31 | 4 | 13 | 0 | 1100 |
| 17 | 322 | 809 | 12 | 75 | 1 | 1 | 0 | 1220 |
| 18 | 326 | 2319 | 14 | 33 | 8 | 2 | 0 | 2702 |
| 19 | 551 | 1091 | 21 | 39 | 3 | 0 | 6 | 1711 |
| 20 | 1154 | 1966 | 49 | 110 | 16 | 1 | 2 | 3298 |
| 21 | 622 | 768 | 38 | 118 | 6 | 0 | 1 | 1553 |
| 22 | 393 | 559 | 59 | 43 | 7 | 1 | 4 | 1066 |
| 23 | 155 | 98 | 55 | 26 | 0 | 0 | 1 | 335 |
| Total | 6676 | 26016 | 532 | 1037 | 176 | 77 | 51 | 34565 |
| Percentage | 19.31 | 75.27 | 1.54 | 3.00 | 0.51 | 0.22 | 0.15 | 100 |
Households Based on Type of Roof
Households Based on Type of Roof
Tap bars or slices to view details
Out of the total 34,565 households in this city, the highest number of families live in houses with cement/concrete roofs, totaling 26,016 (75.27%). Similarly, 6,676 (19.31%) households have zinc/tin roofs, 1,037 (3%) have tiled roofs, 532 (1.54%) have thatch/straw roofs, and 176 (0.51%) have stone/slate roofs. Additionally, 77 (0.22%) households are found to have wood/plank roofs, while 51 (0.15%) have other types of roofing.
7.4.2 Details regarding Government Buildings
Local levels need to construct municipality office buildings, ward office buildings, and other essential government buildings on their own land or land received from the Government of Nepal. This makes performance efficient and effective, giving the people a sense of the government's presence. Once such permanent structures are built, federalism takes institutional form.
According to the belief that local government programs should be operated by constructing necessary physical structures in local levels formed under the federal governance system, it is necessary for rural municipalities/municipalities to have their own community buildings and assembly halls. Currently, the details of community buildings and assembly halls in the Sub-Metropolitan City are included in the table below.
| S.N. | Name of Government and Community Building | Ward No. | Current Status | Remarks |
|---|---|---|---|---|
| 1 | Dharamshala | 1 | ||
| 2 | Community Building | 2 | ||
| 3 | Musafir Khana | 3 Eklaini | ||
| 4 | Dharamshala | 3 Triveni Mod | ||
| 5 | Kaunilal Dharamshala | 8 | ||
| 6 | Community Building | Bhrikutinagar 10 | ||
| 7 | Senior Citizen Meeting Center | 12 | ||
| 8 | Lolenpur Dharamshala | 13 | ||
| 9 | Mahaparwa Dharamshala | 13 | ||
| 10 | City Hall (Nagar Bhawan) | 14 | ||
| 11 | Durga Dharamshala | 20, Manikapur | ||
| 12 | Yadav Dharamshala | 20, Rameshpur | ||
| 13 | Pashupati Temple Dharamshala | 20, Samjhanachowk | ||
| 14 | Gaushala | 21 | ||
| 15 | Yoga Hall | 22 | ||
| 16 | Ward Office | 23 |
7.4.3 Details of Slaughterhouse
If the local government works by placing public health at a high priority, healthy and positive-thinking citizens can be produced who can contribute to development, construction, and services. Therefore, it is desirable to construct clean slaughterhouses equipped with modern technology, ensuring people's right to food security, and developing and implementing policies that require specific standards to be met before slaughtering meat animals and birds. Systematic slaughterhouses are not in operation within Nepalgunj Sub-Metropolitan City. Animals are slaughtered in fresh houses and open spaces.
7.4.4 Details of Cremation Ground
In Nepal, the tradition of performing death rituals according to religious traditions has been going on since ancient times. The management of cremation grounds and burial sites (samadhisthals) according to the religion and culture of each community and municipality is an important and sensitive issue and necessity. This topic, which also carries emotional significance, should be addressed in a timely manner by any plan. Otherwise, unmanaged cremations would add a challenge to the city's environmental, social, and cultural system. Cremation grounds and burial sites that have been traditionally operated must be made convenient and systematic in the future. Currently, the details of cremation grounds and burial sites in operation within the Sub-Metropolitan City are included in the table below.
| S.N. | Name of Cremation Ground / Burial Site / Cemetery | Address | Caste/Community |
|---|---|---|---|
| 1 | Masanghat | Ward No. 8 | Hindu (Cremation) |
| 2 | Lodhai Village, Bulbulia Cremation Ground | Ward No. 13 | Hindu (Cremation) |
| 3 | Matanpurwa, Balegaon, Babugaon, Kairatipurwa, Gasarhipurwa (Cremation Ground) | Ward No. 14 | Hindu (Cremation) |
| 4 | Baikunthadham Masanghat | Ward No. 15 | Hindu (Cremation) |
| 5 | Dihiwa Cremation Ground | Ward No. 16 | Hindu |
| 6 | Cemeteries in various locations | Ward No. 17 | Muslim |
| 7 | Khaskadhoko Cemetery | Ward No. 18 | Muslim |
| 8 | Gayatri Nagar, Nayabasti, Duduwa Cremation Ground, Manikapur Cemetery | Ward No. 20 | Hindu/Muslim |
| 9 | Pitti Baldev Nagar | Ward No. 21 | |
| 10 | Cemetery near Maharaja Religious School, East of Birta, and Cemetery near Maharaja School | Ward No. 22 | Muslim |
| 11 | Bhajjapurwa, Jangalipurwa Cemetery | Ward No. 23 | Muslim |