Digital Profile of Nepalgunj Sub-Metropolitan City
Comprehensive situational analysis of Nepalgunj Sub-Metropolitan City — geographical, demographic, economic, social, and physical infrastructure data and analysis.
Introduction
Background, objectives, and legal framework of the municipality
1.1 Background
After a long and sacrifice-filled struggle of the Nepali people, a federal democratic republican state system has been established in Nepal. As this system, which has been successfully practiced in various countries around the world, is new to Nepal, it will certainly take some time to become accustomed to it. A strong aspect of the federal governance system is citizen-centric governance. Under Nepal's federal system, the state structure has been divided into three tiers. The Constitution of Nepal has established local levels as local autonomous governments alongside the federal (central) government, provincial government, and the lowest tier of local government. Schedule 8, Serial No. 6 of the Constitution states that the entire authority regarding the collection of local data and records belongs to the local government, while Section 11(2)(d) of the Local Government Operation Act, 2074 further expands upon the matters mentioned above.
Therefore, by exercising the authority provided by the Constitution of Nepal and the Local Government Operation Act, 2074, this profile has been prepared with the belief that it will help guide the sub-metropolitan city towards the right direction of development and prosperity, serving as the primary source for development planning, policy formulation, and local information at the local level, in accordance with the Village/Town Situational Profile Preparation Procedure, 2078 prepared by the Ministry of Federal Affairs and General Administration.
1.2 Objectives
The main objective of preparing the situational profile is to systematically record the overall situational information of the sub-metropolitan city and to update those data or information and make them available to stakeholders when necessary. The other specific objectives of the situational profile are as follows:
(a) To prepare a record of information and data related to the overall physical infrastructure, economic aspects, social aspects, natural resources, and disaster management of the sub-metropolitan city.
(b) To prepare a record of information and data about service delivery and institutional mechanisms.
(c) To analyze strengths, weaknesses, opportunities, challenges, and possibilities.
(d) To prepare thematic base maps for various subjects.
(e) To explain and analyze overall demographic, economic, social, physical, natural, historical, religious, and cultural data.
(f) To classify the received information, organize it in a systematic and simple manner, and present it divided into various sections so that it can be understood by the general public.
(g) To prepare a consolidated statistical base related to all the subjects mentioned above.
1.3 Legal and Policy Framework
As mentioned in the background, the following are the bases for preparing the situational profile of the sub-metropolitan city.
(a) Constitutional Basis
The Local Government Operation Act, 2074, enacted to interpret Schedules 8 and 9 of the Constitution of Nepal, grants the rights and responsibilities of maintaining and updating local data records to local governments. This has provided the sub-metropolitan city with the basis to prepare its situational profile.
(b) Policy Bases
Under the policy bases, overall plans, policies, and provincial policies prepared by the Government of Nepal, as well as local-level policies developed on these foundations, require factual data as a fundamental necessity for their implementation. Since there exists both a policy need to prepare comprehensive information for the sub-metropolitan city and a policy framework for information management, this situational profile has been prepared on those grounds.
(c) Local Necessity
Objective information is necessary to operate local government and to identify local needs. Once local needs are identified, development policies, plans, and programs can be formulated. Therefore, a comprehensive compilation of information and data necessary for advancing the overall development process and operating local government is essential, making this another important basis for preparing this situational profile.
In addition, objective information is required to implement international treaties and agreements that Nepal has signed as a party state. Since factual information is needed to achieve sustainable development goals, mitigate climate change impacts, ensure human rights, and maintain environmental balance for sustainable development, this profile has been prepared based on these needs.
1.4 Preparation Stages
The following methods were used in preparing the situational profile of this sub-metropolitan city –
Data available from various thematic branches, thematic offices, and various organizations of the sub-metropolitan city were included.
Data was collected through direct interview methods with ward chairpersons and other officials of all wards.
Results of the National Census 2078 and other various surveys were included.
During the analysis of data in this study report, various tables, charts, and maps were used to carry out descriptive and comparative analyses.
Primary and Secondary Data Collection
The work of preparing the situational profile was carried out using both Primary and Secondary information collection methods. Data such as land use, roads and their quality, and environmental problems were collected using Geographic Information System data (GIS Data), topographic maps, aerial maps, survey maps, field inspection, and interview methods. Additionally, information about the major problems and development possibilities of the sub-metropolitan city was obtained by holding discussions and interviews with officials of various government and non-government bodies, intellectuals, and reputable personalities located in the sub-metropolitan city. Overall data of the sub-metropolitan city such as physical, environmental, social, economic, financial, and institutional data was collected from the records of the sub-metropolitan city office and government and non-government offices in the sub-metropolitan city, and some data were collected by studying reports and books published by relevant departments and other bodies.
1.4.1 Profile Format, Tools and Procedure Preparation
The following activities were carried out in the first phase of this preparation:
A decision was made by the executive meeting to commence the situational profile preparation work in a way that reveals the geographical status, population, social, economic, natural, physical, environmental, and institutional situation of the Nepalgunj Sub-Metropolitan City area and provides geographically and socially disaggregated information.
According to the standard format of the situational profile, the questionnaire was finalized with the involvement of experts, incorporating results from the National Census 2078 and various other surveys, for institutional surveys and participatory accounting surveys.
1.4.2 Profile Preparation Workshop
For the preparation of the situational profile, Nepalgunj Sub-Metropolitan City organized a one-day situational profile preparation workshop with the participation of the Mayor, Deputy Mayor, executive members, Chief Administrative Officer, ward secretaries, heads of thematic branches/sub-branches/units, and knowledgeable local experts or local specialists selected by the sub-metropolitan city. The workshop aimed to build common understanding, clarity, and ownership among executive officials, staff, and stakeholders regarding the standard format, data sources, collection and analysis preparation methods, and to develop a work plan through discussion and determine the responsibilities and work plan for preparing the situational profile.
1.4.3 Data Collection
To construct the situational profile here, two types of data were collected: institutional information and data received from the National Census 2078, Agricultural Census, various surveys, Human Development Report, and others. Under institutional data collection, data were collected through questionnaires with the cooperation and coordination of each ward office and various branches of the executive. In the context of collecting institutional data, GIS Coordinates were taken to organize the resource map and GIS Mapping.
1.4.4 Data Processing, Analysis and Resource Mapping
Computer software was designed and developed to organize and analyze the received data, tables were prepared as needed, and MS Excel was also used for additional analysis. All types of received data were analyzed using MS Excel. For resource map preparation, both methods were used: creating GIS-based resource maps using software based on GIS Database, and using Mapping through Google Map by entering GIS Coordinates in the software developed for data management.
1.4.5 Draft Profile Preparation
By organizing the reports obtained from data processing, analysis, and resource map preparation, and following the directions of the Situational Profile Preparation Procedure 2078, experts prepared the draft report of the situational profile and submitted it to the sub-metropolitan city within a specified time period.
1.4.6 Feedback Collection
After the first draft of the municipality's situational profile was prepared in the prescribed format, a one-day validation workshop was organized at the executive level to discuss the draft situational profile. The activities carried out at the validation workshop included: collecting feedback for improvement by verifying the accuracy and facts of information and descriptions presented, exchanging feedback to include subject areas not covered by the draft situational profile or aspects that need to be revised, verifying the interrelationships and comparative aspects of data, information, and descriptions presented in the situational profile, and declaring commitment to use the profile's information in plan formulation, development construction, service delivery, performance, and result monitoring after publication of the situational profile.
1.4.7 Final Report Preparation of the Sub-Metropolitan City's Situational Profile
The situational profile was finalized by incorporating the feedback received from the workshop, re-consulting with relevant stakeholders as needed regarding topics that need to be revised in the draft report and the feedback presented at the workshop, and by paying attention to the feedback from experts to ensure the standard and quality of the situational profile.
1.5 Scope of Profile
As determined by the National Planning Commission and the Ministry of Federal Affairs and General Administration, the sources and base year of data used in preparing the sub-metropolitan city profile have been disclosed. This situational profile has been prepared based on data available from thematic branches of the sub-metropolitan city, government and non-government offices, data provided by other organizations, various ministries, departments, and other sources.
According to the concept of the situational profile, it provides accurate information about all aspects of Nepalgunj Sub-Metropolitan City in a simple and clear manner. Every effort has been made to make the study as objective as possible. However, due to limitations in sources, resources, and information management, all expected information could not be obtained. Nevertheless, data necessary according to the objectives defined in the study have been included.
Municipal Identity
Geographical location, historical background, and natural resources
2.1 Geographical Location
Nepalgunj Sub-Metropolitan City is located in Banke District within Lumbini Province. It lies between 28° 02' 48" N to 28° 07' 12" N latitude and 81° 35' 24" E to 81° 41' 24" E longitude. It sits at an elevation of approximately 150 meters above sea level.
The sub-metropolis is bounded by Duduwa Rural Municipality to the east, Khajura Rural Municipality to the west, Janaki Rural Municipality to the north, and the Indian state of Uttar Pradesh to the south. Its total area is 85.94 square kilometers.
2.2 Historical Background and Naming
Banke, Bardiya, Kailali, and Kanchanpur were returned to Nepal by the British government around 1917 B.S. as a gesture of gratitude for the assistance provided by Prime Minister Jung Bahadur Rana. This territory became known as 'Naya Muluk' (New Country). The market of Nepalgunj was established during this period. The name 'Nepalgunj' is derived from 'Nepal' and 'Gunj' (meaning market).
Since its historical origins, the city has evolved as a vital commercial hub. Recognized as the primary gateway to Western Nepal, it is celebrated as a center of religious tolerance and communal harmony.
2.3 Political and Administrative Structure
Nepalgunj Municipality was established in 2017 B.S. according to historical records. Following the declaration of the sub-metropolis on 2071/08/16 B.S., 28 former wards were consolidated into the current 13 wards. This administrative restructuring reflects the city's expansion and its central role in the federal governance system of Nepal.
| Ward No. | Included Former Wards/VDCs | Area (sq. km.) | Center |
|---|---|---|---|
| 1 | Nepalgunj Mun. former 7, 8 | 1.05 | Dhamboji |
| 2 | Nepalgunj Mun. former 9, 10 | 0.64 | Gharbari Tole |
| 3 | Nepalgunj Mun. former 11, 12, 25 | 1.11 | Eklaini |
| 4 | Nepalgunj Mun. former 13, 14, 15, 16, 22 | 1.35 | Ganeshpur |
| 5 | Nepalgunj Mun. former 1, 2, 3, 4, 5, 6 | 0.75 | New Road |
| 6 | Nepalgunj Mun. former 17, 18, 19 | 0.98 | Phultekra |
| 7 | Nepalgunj Mun. former 20, 21 | 0.94 | Gaganpur |
| 8 | Nepalgunj Mun. former 23, 24, 26 | 1.12 | Mahendra Park |
| 9 | Nepalgunj Mun. former 27, 28 | 1.15 | Eye Hospital |
| 10 | Nepalgunj Mun. former 3, 5 | 3.44 | Brikuti Nagar |
| 11 | Nepalgunj Mun. former 10, 11 | 3.95 | Karkando |
| 12 | Nepalgunj Mun. former 13 | 5.21 | Belaspur |
| 13 | Nepalgunj Mun. former 14, 15 | 6.82 | Udayapur |
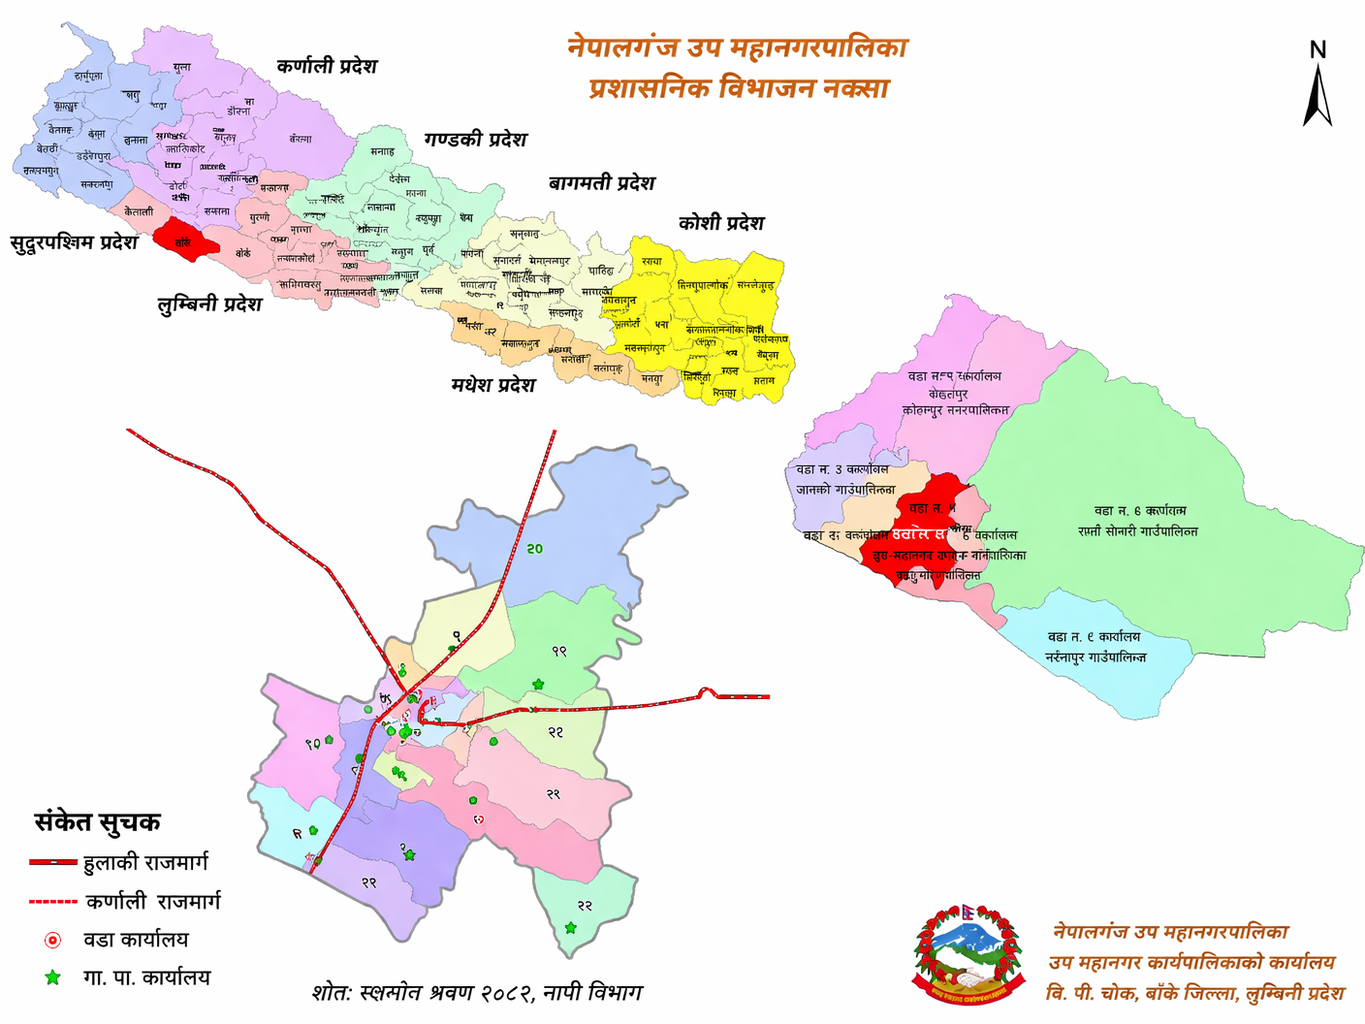
Map No. 1: Administrative Division Map
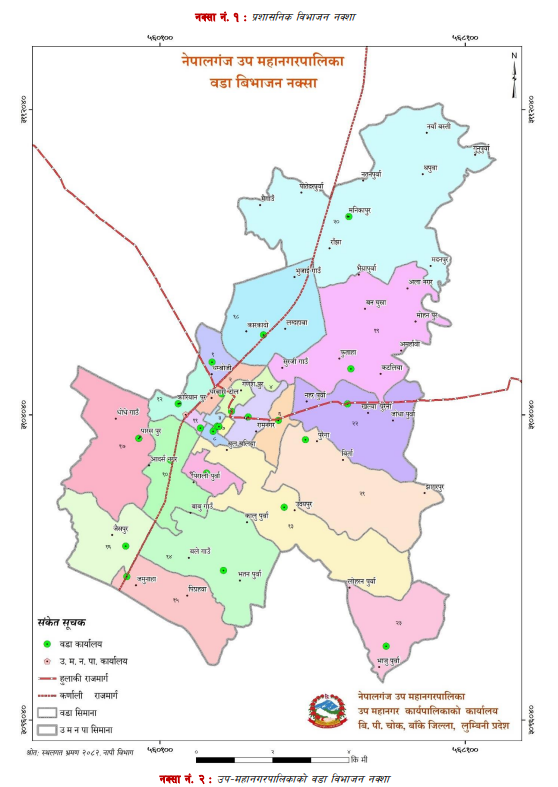
Map No. 2: Ward Division Map
2.4 Terrain
Description of the terrain is a crucial element when reporting on a sub-metropolis's physical conditions. Nepal, while small in area, possesses a globally distinguished geographical diversity. The current land surface of Nepal was formed by the collision of the Indian Plate and the Tibetan Plate, eliminating the Tethys Sea. This sub-metropolis sits atop a segment of the fertile Gangetic plain, a topographical feature that plays a decisive role in regional planning and sustainable infrastructure development.
A) Soil Composition
The geological structure of this sub-metropolis is primarily silt-mixed and highly fertile. Regions adjacent to rivers and streams tend to have sandier soil, while inner areas are characterized by clay-loam rich in organic matter. This soil profile is exceptionally well-suited for intensive agricultural production.
B) Slope Analysis
Land classification in Nepalgunj is categorized by its suitability for agriculture and its susceptibility to soil erosion. Given its location in the Terai region, much of the sub-metropolis is flat, presenting minimal slope diversity.
Slope 0°-5°: Sufficient soil depth and excellent drainage define this category. While traditional and modern farming are both viable, maintaining surface water management is necessary to prevent gully formation.
Slope 5°-10°: While fertile, land in this range requires careful embankment management to prevent soil movement. Forest and vegetation are generally the preferred land uses here.
Slope 30°-40°: Comprised of thin soil layers (approx. 20 cm) and steep gradients, this land category is most effectively used for protective vegetation and timber production to mitigate the risk of landslides.
Slope > 40°: Highly steep land with very shallow soil layers. Conservation through permanent greenery (trees or shrubs) is mandatory to ensure environmental stability.
C) Aspect Description
A detailed analysis concerning the land's aspect is presented below, detailing how orientation and sunlight influence agricultural and settlement patterns.
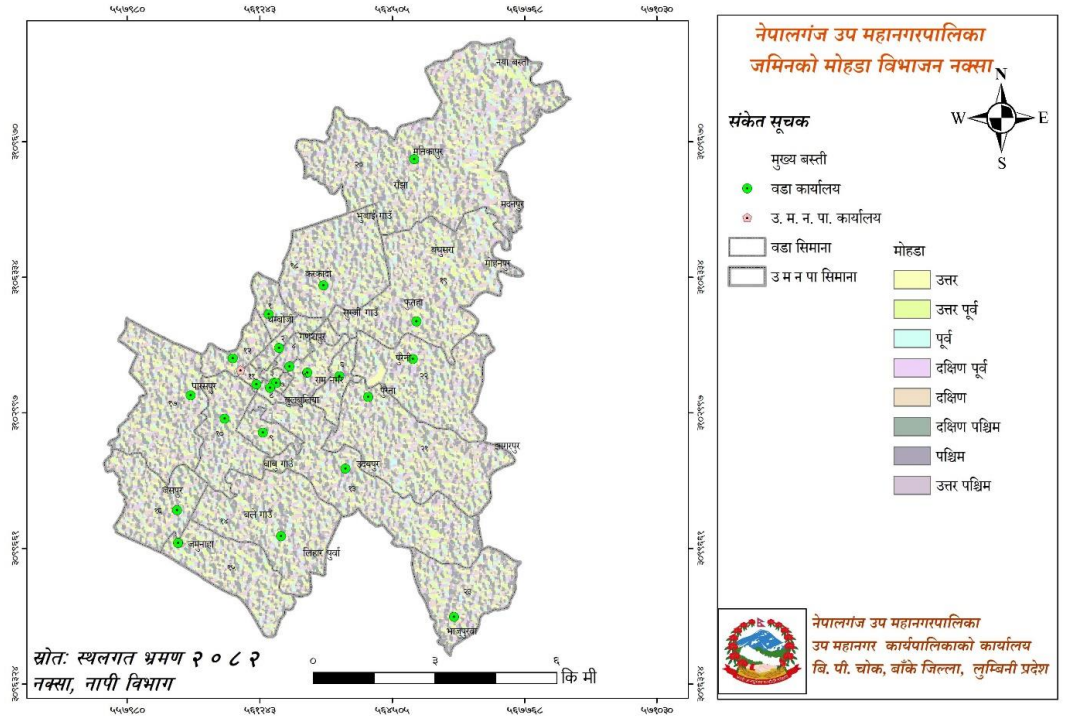
Map No. 3: Map of Sub-Metropolitan City
Land slope and aspect are generally complementary to each other. This means that when the slope is irregular, the aspect also tends to be irregular. Although there is no significant diversity in aspect in flat areas, the following is the aspect description for the sub-metropolis:
| Aspect (Facing) | Area (sq. km.) | Area (Percentage) |
|---|---|---|
| North | 11.69 | 13.60 |
| North-East | 10.12 | 11.77 |
| East | 9.89 | 11.50 |
| South-East | 11.35 | 13.21 |
| South | 11.48 | 13.35 |
| South-West | 10.65 | 12.40 |
| West | 10.06 | 11.71 |
| North-West | 10.71 | 12.46 |
2.5 Natural Resources
The primary basis for the development of any region is the natural resources available there. Natural resources include locally available land, forests, flora, fauna, herbs, mines and minerals, rivers, streams, lakes, mountains, waterfalls, watershed areas, wetlands, parks, reserves, and protected areas. Only by ensuring the sustainable and wise utilization of these natural assets can we achieve prosperity.
2.6 Cultural Excellence
Human habits, language, behavior, and daily life are guided by specific traditions in an abstract way. To carry out daily activities, people are bound within the framework of family and society. Traditions establish kinship through marriage and this creates a family. Birth, death, marriage, food, dress, festivals, language, and lifestyle all fall within cultural characteristics. These dimensions of civilization and culture are the major aspects of human identity. Cultural activities help people live a refined life. It makes society organized and dynamic.
According to the 2078 National Census, 113,028 people, or 68.7%, in the Sub-Metropolitan City are Hindus. Similarly, 48,251, or 29.3%, are Muslims, 1,154, or 0.7%, are Buddhists, and 1,432, or 0.9%, are Christians. The followers of these religions celebrate festivals such as Dashain, Tihar, Ram Navami, Maha Shivaratri, Haritalika, Shree Panchami, Janmashtami, Holi, Chaite Dashain, Sankranti, Mother's Day, Akshay Tritiya, Ekadashi, Nag Panchami, Raksha Bandhan, Father's Day, Bala Chaturdashi, New Year, Chhath, Christmas, Eid, and Bakra-Eid.
People of various castes, religions, sects, and attires live in this Sub-Metropolitan City. Each has its own unique religion, culture, and customs. In this Sub-Metropolitan City, where the Muslim and Chhetri communities are predominant, during festival times, Chhetris wear traditional attire like Ganyu, Cholo, and Patuka, while Muslim women wear Saree-Blouse, Kurta-Suruwal, Burqa, or Hijab, and men wear Jubba or Suruwal-Kurta. However, in modern times, youth of all communities increasingly prefer wearing pants, shirts, t-shirts, and other modern clothing.
2.7 Key Development Possibilities
Every location has its unique characteristics. In some areas, forest land is excessive, while others have plenty of water resources or are dry. Therefore, in agricultural areas, upgrading can be done through commercialization, while in forest-rich areas, prosperity can be achieved through sustainable forest management. Potential can be explored based on available sources and tools. Here, cultivable land stands at 80.14%. Prosperity can be achieved through a scientific agricultural system.
Sustainable forest management involves taking care of and improving forest areas like harvestable crops. Potential and opportunities within the Sub-Metropolitan area include traditional and modern agriculture, herbs, tourism, animal husbandry, and small and medium-scale industrial development. Furthermore, there are ample opportunities to develop parks, gardens, and religious heritage sites as tourist attractions.
In the cultivable land within the Sub-Metropolitan area, there are abundant possibilities to increase production of food grains, other cash crops, vegetables, fruits, pulses, spices, and herbs, as well as animal-related production. Due to the lack of modern agricultural technology, fertilizers, and tools, as well as their maximum cost price, their use has been limited and agricultural production hasn't increased as required. There are abundant possibilities to improve the economic situation through awareness, skills, commercialization, modernization, technology transfer, and simplified availability of needed tools, fertilizers, loans, and seeds.
With abundant potential for dairy and livestock production in rural areas of the Sub-Metropolitan area, expanding these businesses and extending transport services conveniently to their reach can help develop dairy chilling centers, agricultural collection centers/cold storage, and meat-related industries. This offers a significant opportunity to create employment and increase the overall income of the Sub-Metropolitan City.
Remarkable increase in agricultural production can be achieved by utilizing underground water sources and rivers through modern canals and irrigation systems for commercial farming.
By upgrading and blacktopping local gravel roads, local residents can fully benefit from such facilities, and it can also upgrade living standards and enhance the beauty of the entire Sub-Metropolitan City.
Abundant possibilities for tourism development exist, as there are various historical, religious, and cultural sites within this area.
Government, non-government, and private organizations active in the area appear as potential partners in the Sub-Metropolitan City's development.
Industrial, trade, and commercial development potential is emerging in the context of increasing consumers within the Sub-Metropolitan area.
2.8 Household Production
Gross Domestic Product (GDP) is a measure that reflects the overall economy of a country. It represents the total final transaction value of goods and services produced within a country or a place over a specific period. It includes all private and public consumption, government spending, investment, materials in stock, expenses during construction, and expenses and income from imports and exports. In Nepal, this is calculated annually. According to Trading Economics, in 2023, Nepal's GDP was approximately 40 trillion rupees, and its per capita income was 1,399 US dollars.
2.9 Human Development Index
According to the United Nations Development Programme (UNDP) 2025 report, Nepal's human development index is 0.622, ranking Nepal 145th among 193 countries in the world. Among these countries, Nepal last year was in 146th position, but this year it rose one place. In 1990, the human development index of Nepal was 0.398. During that period, the average life expectancy of Nepalis was 70.4 years. Similarly, according to the second periodic plan 80/81 of Lumbini Province, the human development index is 0.563, and the average life expectancy is 69.5 years. Poverty distribution details are included in the table below.
| Province | Multidimensional Poverty Rate (%) | Poverty (%) | Headcount (%) | Poverty Intensity (%) | Number of Poor | Human Development Index |
|---|---|---|---|---|---|---|
| Lumbini Province | 29.9 | 24.8 | 6.5 | 2.3 | 1,053,379 | 0.468 |
Family and Demographic Profile
Population distribution, ethnicity, occupation, and social security
3.1 Main Settlement and Household Description
3.1.1 Main Settlement
Since Nepalgunj Sub-metropolitan City is located in the Terai region, its climate is very hot in the summer and very cold in the winter. However, due to its fertile soil and flat land, it is considered suitable for settlement. Due to the availability of services, facilities, and opportunities such as access to airports, hospitals, industries, telephones, and schools, as well as transportation facilities, migrations to Nepalgunj are observed from nearby districts and even from hilly districts. Accordingly, the pressure of population is seen to be increasing in the settlement and market areas of the sub-metropolitan city. In addition, internal transportation routes have been created by the sub-metropolitan city in various places, managing markets in public sectors and gradually developing as a commercial center.
To develop the housing areas of this place in a systematic manner, programs such as land pooling or service facilities must be operated to develop systematic settlements including the construction of physical and infrastructure such as motor roads to reach each settlement, provisions for open areas, and square-shaped residential plots. When operating such land development programs, priority should be given to support the areas proposed for urban expansion. The details of the main settlements currently located here are included in the table below.
| Ward No. | Details of Main Settlements |
|---|---|
| 1 | Shiv Parvati Tol, Dailekhi Marg, Sangam Tol, Deep Nagar, Chandan Tol, Muslim Tol, Bilaspur, Nandani Mill Tol, Bishal Nagar, D.P.O. Area, Khajura Road |
| 2 | New Road, Buddha Tol, Gharbare Tol, Bageshwori Tol, Maniharan Tol, Kaharan Tol, Latian Tol, Buddha Tol, Bikas Nagar |
| 3 | Cinemahall Road, Kasgar Tol, Ekaini Tol, Rani Talau Tol, Kumhas Tol, Debiganj Tol, Subba Biredhu Keshari Tol, Sadar Line, Sonarmandi, Biskorian Tol |
| 4 | Ganeshpur, Dewa Phulawari, ABC School Area, Salyani Bag, Ghositol, Buddhatol |
| 5 | Jinnat Bawa Tol, Bhattahatol, Baccha Purwa, Behanatol, Phultekra |
| 6 | Madrasa Tol, Ramnagar, Phultekra Village, Ektanagar, Naya Basti, Phultekra to Fatebal Eye Hospital, Barrack Tol, Kalika Tol |
| 7 | Gaganganj, D.S.P. Road |
| 8 | Ghasiyaran Tol, Naka Tol, Pashupati Tol, Shantinagar Tol, Shiv Santoshi Tol, Shraddhanagar Tol, Samabeshi Tol, Anandnagar Tol |
| 9 | Dhapali Tol, Bouddha Tol, Piripurwa |
| 10 | Bhrikuti Nagar, Adarsh Nagar, Bhrikuti Nagar, Sheetal Nagar, Gosai Gaun, Siddharth Tol, Chaulika, Chetnanagar, Sugandha Binayak Tol, Sokia Tol, Annapurna Tol, Pragatisheel Tol, Balaji Tol, Hanuman Marg Tol, Bindhyabasini Tol, Surkhet Tol, Pasang Lhamu Marg, Charbahini |
| 11 | Bhattahatol, Kasgar Tol, Nabha Tol, Bhawani Bag, Sadarline, Surkhet Road, Jabdahatol, Medicine Dealers Association Tol, Sunar Mandi, Bhatti Tol, Idgah Road |
| 12 | Belaspur, Koreanpur, Muktipur, Belaspur, Surkhet Road West Shiv Bhairav Tol, Kammarsaha Tol |
| 13 | Ghasiyaran Tol, Bul Buliya, Chamar Tol, Lodhaigaun, Lalpurja, Bulbuliya, Gangapur, Lothaigaun, Udaipur, Lolanpur, Telanpur |
| 14 | Bawagaun, Kairati Purwa, Balegaun, Bhatjapurwa, Gulam Purwa, Suthkupurwa, Bhawaniyapur, Kairatipurwa, Babhanpurwa, Bawagaun, Balegaun, Bhannupurwa, Riharpurwa, Balapur, Gosapurwa, Udhaupurwa, Kallupurwa |
| 15 | Jamunaha, Suiya, Tangpasari Village, Piprahwa Village, Suiya Village, Naya Basti |
| 16 | Jaispur, Sakir Tol, Janupurwa Tol, Adharbhut Tol, Badi Masjid Tol |
| 17 | Thakaila, Nandagaun, Paraspur, Dandaigaun, Paraspur, Dhodegaun, Bhrikuti Nagar |
| 18 | Nagdahawa, Bhujahawa, Karkado, Lakdhabha, Khaskarkado, Bhujargaun |
| 19 | Sano Bhaiyapur, Alanagar, Banwansa, Katalia, Suiya, Phutaha, Subhigaun, Shantinagar, Mohanpur, Pharamtol, Alanagar |
| 20 | Madanapur, Pharamtol, Thapuwa, Natanpur, Rameshpur, Maigaun, Gayanpur, Potedar Pur, Sukhrampur, Thapuwa Bauntol, Ranjha Airport |
| 21 | Gangaram purwa, Birta, Telian Purwa Bhagnapur, Gangaram Buruba, Puraina, Pirta Village, Tilenpur, Bhagatpur, Baladevnagar, Mohanpur, Naya Basti |
| 22 | Kidhariyanpurwa, Jodhapur Khalla, Paraininahar Purwa, Loniyanpur, Teliyanpur, Shahapurwa, Naharpurwa, Puraini, Khalla Puraini, Loniyan Purwa, Shahapurwa, Jodhpurwa, Kidhariyanpurwa |
| 23 | Junglisingh Puruwa, Bhajju Puruwa, Lohatanpurwa |
3.1.2 Household Details
The details of households in Nepalgunj Sub-Metropolitan City are as follows:
| Ward | Households | 2068 Pop | 2078 Male | 2078 Female | 2078 Total | Growth Rate | Area (km²) | Density | Avg Family | Ratio |
|---|---|---|---|---|---|---|---|---|---|---|
| 1 | 2167 | 8255 | 4436 | 4554 | 8990 | 0.89 | 0.96 | 9364.6 | 4.1 | 97.41 |
| 2 | 1363 | 5862 | 3171 | 3073 | 6244 | 0.65 | 0.72 | 8672.2 | 4.6 | 103.19 |
| 3 | 556 | 3933 | 1700 | 1613 | 3313 | -1.58 | 0.16 | 20706 | 6.0 | 105.39 |
| 4 | 2918 | 9950 | 6320 | 6418 | 12738 | 2.80 | 0.78 | 16331.8 | 4.4 | 98.47 |
| 5 | 1137 | 4922 | 2996 | 2876 | 5872 | 1.93 | 1.27 | 4623.6 | 5.2 | 104.17 |
| 6 | 1411 | 4285 | 3226 | 3140 | 6366 | 4.86 | 1.11 | 5735.1 | 4.5 | 102.74 |
| 7 | 682 | 3393 | 1750 | 1695 | 3445 | 0.06 | 0.16 | 21344 | 5.0 | 105.11 |
| 8 | 852 | 4223 | 2376 | 2241 | 4617 | 0.93 | 0.25 | 18468 | 5.4 | 106.02 |
| 9 | 1425 | 4420 | 2776 | 2758 | 5534 | 2.52 | 1.01 | 5479.2 | 3.9 | 100.65 |
| 10 | 2663 | 7959 | 4684 | 4771 | 9455 | 1.88 | 3.25 | 2909.2 | 3.6 | 98.18 |
| 11 | 1001 | 5871 | 2844 | 2678 | 5522 | -0.59 | 0.23 | 24009 | 5.5 | 106.20 |
| 12 | 1738 | 6773 | 3590 | 3654 | 7244 | 0.70 | 1.25 | 5795.2 | 4.2 | 98.25 |
| 13 | 1466 | 6324 | 3597 | 3402 | 6999 | 1.07 | 0.76 | 925.79 | 4.8 | 105.73 |
| 14 | 1056 | 4326 | 3296 | 3056 | 6352 | 4.68 | 6.36 | 998.74 | 6.0 | 107.85 |
| 15 | 1145 | 5455 | 3313 | 3176 | 6489 | 1.90 | 3.92 | 1655.4 | 5.7 | 104.31 |
| 16 | 1100 | 6567 | 3999 | 3673 | 7672 | 1.68 | 3.61 | 2125.2 | 7.0 | 108.88 |
| 17 | 1220 | 5983 | 3177 | 3103 | 6274 | 0.49 | 5.74 | 1093 | 5.1 | 102.19 |
| 18 | 2702 | 8910 | 6034 | 6013 | 12047 | 3.52 | 5.48 | 2198.4 | 4.5 | 100.35 |
| 19 | 1711 | 6830 | 4171 | 4366 | 8537 | 2.50 | 8.78 | 972.32 | 5.0 | 95.53 |
| 20 | 3298 | 12233 | 7282 | 7485 | 14767 | 2.07 | 16.35 | 903.18 | 4.5 | 97.29 |
| 21 | 1553 | 6264 | 4118 | 4099 | 8217 | 3.12 | 7.46 | 1101.5 | 5.3 | 100.46 |
| 22 | 1066 | 4724 | 2991 | 2943 | 5934 | 2.56 | 5.61 | 1057.8 | 5.6 | 101.63 |
| 23 | 335 | 1489 | 914 | 932 | 1846 | 2.40 | 3.92 | 470.92 | 5.5 | 98.07 |
| Total | 34565 | 138521 | 82755 | 81689 | 164444 | 1.83 | 85.94 | 1913.5 | 4.8 | 101.30 |
Ward-wise Total Population Distribution
Tap bars or slices to view details
Analyzing the ward-wise population of the sub-metropolitan city, the highest population is in ward no. 20 with a total population of 14,767 (7,282 males and 7,485 females). The average family size of this ward is 4.5 and the number of households is 3,298. Similarly, the lowest population is in ward no. 3 with a population of 3,313 (1,700 males and 1,613 females) while the number of households is 556 and the average family size is 6.0. The lowest population density is in ward no. 23 with a population density of 470.91 persons per sq. km. while the highest population density is in ward no. 11. Detailed details are mentioned in the table above and the table is presented in the bar chart below.
3.2 Population Distribution Status
The population of any place exists as both a means and an end of development. Since the mobilization of other economic and physical resources required for development occurs through human resources, it is necessary to study and analyze various aspects of its composition when formulating development plans. In Nepal, data on various aspects of the population is obtained through the National Census held every 10 years, as well as through household surveys at the sub-metropolitan level. Here, various aspects of the population are analyzed based on the data obtained from the National Census, 2021.
| Description | B.S. 2078 (2021) |
|---|---|
| Total Population | 164444 |
| Total Male | 82755 |
| Total Female | 81689 |
| Sex Ratio (per 100 females) | 101.30 |
| Total Households | 34565 |
| Average Family Size | 4.8 |
| Population Density (per sq. km.) | 1913.5 |
| Population Growth Rate (%) | 1.83 |
| Literacy Rate (5 years and above) | 76.2 |
The population details of Nepalgunj Sub-metropolitan City are presented in the table above. According to the 2021 National Census data, the total population of the sub-metropolitan city is 164,444, of which 50.32% (82,755 people) are male and 49.68% (81,689 people) are female. Accordingly, the sex ratio (the number of males per 100 females) is 101.30. The population density is 1,913.5 people per square kilometer. Among the total population of this sub-metropolitan city, 2,612 people, or 1.6%, are persons with disabilities. In this sub-metropolitan city with a total of 34,565 households, the average family size is observed to be 4.8 members per family.
3.3 Population by Age Group and Gender
Of the total population of 164,444 in the sub-metropolitan city, there are 82,755 males and 81,689 females. Males are predominant in the age groups of 0 to 19 years and 40 to 64 years, while females are predominant in the remaining age groups. Looking at the age groups in this way, it is necessary to formulate plans that address the physical, mental, social, and economic issues of adolescent girls and women in the age group of 15 to 39 years and elderly women. Issues such as reproductive health, sexual health, menstruation-related problems, female-friendly toilets, counseling centers, violence against women, trafficking of girls, domestic gender-based violence, uterine prolapse, dowry system, child marriage, women's empowerment, and rights are major and sensitive issues for women. The overall statistics indicate that the sub-metropolitan city should formulate and implement effective plans for these subjects. Detailed ward-wise information is presented in the table.
| Age Group | Male | Female | Total |
|---|---|---|---|
| 00-04 Years | 7344 | 6650 | 13994 |
| 05-09 Years | 8874 | 7819 | 16693 |
| 10-14 Years | 8760 | 8053 | 16813 |
| 15-19 Years | 9233 | 8514 | 17747 |
| 20-24 Years | 8138 | 9056 | 17194 |
| 25-29 Years | 6994 | 8023 | 15017 |
| 30-34 Years | 6225 | 6943 | 13168 |
| 35-39 Years | 6040 | 6480 | 12520 |
| 40-44 Years | 5338 | 5017 | 10355 |
| 45-49 Years | 3989 | 3864 | 7853 |
| 50-54 Years | 3481 | 3123 | 6604 |
| 55-59 Years | 2475 | 2264 | 4739 |
| 60-64 Years | 2044 | 1927 | 3971 |
| 65-69 Years | 1523 | 1531 | 3054 |
| 70-74 Years | 1346 | 1370 | 2716 |
| 75-79 Years | 601 | 607 | 1208 |
| 80-84 Years | 206 | 241 | 447 |
| 85-89 Years | 90 | 111 | 201 |
| 90-94 Years | 32 | 64 | 96 |
| 95+ Years | 22 | 32 | 54 |
| Total | 82755 | 81689 | 164444 |
Although it is good that the population of youth (15 to 39 years) is high (75,646), the state must make massive investments in their education, health, and human resource development. Having a large youth age group is called a demographic dividend. On the other hand, it is the responsibility of society and the state to guide the youth in the right direction and involve them in nation-building by creating employment opportunities. The low number of children and infants indicates a gradually decreasing fertility rate, while the low number of elderly and middle-aged people suggests that average life expectancy is lower compared to other countries and that the mortality rate of the older population is high due to diseases occurring in middle age. However, a decreasing number with increasing age is natural. When analyzing the population by age, it is challenging to address the needs of each age group and manage them properly. Providing nutrition, care, and education for children, appropriate employment for youth, and necessary social security, health services, and care for the elderly are among the responsibilities to be fulfilled by the state.
Population data by various age groups is necessary for policy making and plan formulation. The number of infants under one year of age can be useful for vaccination management, comparison of birth registration records, etc. The population of children under five years of age is required to estimate potential numbers for pre-primary and primary levels and for required vaccinations within that age. Similarly, information about the population going to school or outside school and the dependent population in the family is available from the population aged 14 and under. The total child population is known from the population under eighteen years of age. The population of males and females above 68 years of age is important for the budget management required for social security allowances.
| Age Group | Lumbini (Total) | Lumbini (M) | Lumbini (F) | Banke (Total) | Banke (M) | Banke (F) | Nepalgunj (Total) | Nepalgunj (M) | Nepalgunj (F) |
|---|---|---|---|---|---|---|---|---|---|
| Total | 5122078 | 2454408 | 2667670 | 603194 | 296745 | 306449 | 164444 | 82755 | 81689 |
| 00-04 Years | 439841 | 230778 | 209063 | 54373 | 28798 | 25575 | 13994 | 7344 | 6650 |
| 05-09 Years | 497938 | 259850 | 238088 | 63349 | 33360 | 29989 | 16693 | 8874 | 7819 |
| 10-14 Years | 523078 | 268902 | 254176 | 63298 | 32805 | 30493 | 16813 | 8760 | 8053 |
| 15-19 Years | 540900 | 266043 | 274857 | 64332 | 32374 | 31958 | 17747 | 9233 | 8514 |
| 20-24 Years | 496646 | 222524 | 274122 | 61196 | 28076 | 33120 | 17194 | 8138 | 9056 |
| 25-29 Years | 440485 | 191156 | 249329 | 54122 | 24246 | 29876 | 15017 | 6994 | 8023 |
| 30-34 Years | 381940 | 166688 | 215252 | 46520 | 20137 | 25583 | 13168 | 6225 | 6943 |
| 35-39 Years | 357093 | 159440 | 197653 | 43574 | 20538 | 23036 | 12520 | 6040 | 6480 |
| 40-44 Years | 298968 | 137684 | 161284 | 35601 | 17573 | 18028 | 10355 | 5338 | 5017 |
| 45-49 Years | 239702 | 112979 | 126723 | 26768 | 13196 | 13572 | 7853 | 3989 | 3864 |
| 50-54 Years | 226368 | 111759 | 124609 | 24824 | 12338 | 12486 | 6604 | 3481 | 3123 |
| 55-59 Years | 179360 | 88491 | 90869 | 18269 | 9304 | 8965 | 4739 | 2475 | 2264 |
| 60-64 Years | 158359 | 76171 | 82188 | 14839 | 7381 | 7458 | 3971 | 2044 | 1927 |
| 65-69 Years | 130920 | 63584 | 67336 | 12340 | 6088 | 6252 | 3054 | 1523 | 1531 |
| 70-74 Years | 102466 | 49796 | 52670 | 10801 | 5266 | 5535 | 2716 | 1346 | 1370 |
| 75-79 Years | 56426 | 28123 | 28303 | 5429 | 2777 | 2652 | 1208 | 601 | 607 |
| 80-84 Years | 24157 | 12144 | 12013 | 1984 | 978 | 1006 | 447 | 206 | 241 |
| 85-89 Years | 10467 | 5256 | 5211 | 914 | 454 | 460 | 201 | 90 | 111 |
| 90-94 Years | 4294 | 1967 | 2327 | 380 | 151 | 229 | 96 | 32 | 64 |
| 95+ Years | 2670 | 1100 | 1570 | 281 | 105 | 176 | 54 | 22 | 32 |
3.4 Population by Mother Tongue
Nepal is a nation with multi-ethnic, multi-lingual, and multi-cultural characteristics. Linguistic diversity is also seen in this sub-metropolitan city. Out of the total population of 164,444 in the sub-metropolitan city, the highest 80,738 i.e. 49.10 percent were found to speak Awadhi language while 54,680 i.e. 33.25 percent spoke Nepali and 9,957 i.e. 6.05 percent spoke Urdu language. Article 32 of the Constitution has established the right to language and culture as a fundamental right and according to clause 5 of the right to education in Article 31, "every Nepali community residing in Nepal shall have the right to receive education in their mother tongue and to open and operate schools and educational institutions for that purpose as provided for by law." There is a provision that the sub-metropolitan city can make special arrangements for students who want to study in their mother tongue. Detailed details according to mother tongue are mentioned in the table.
| Mother Tongue | Male | Female | Total | Percentage (%) |
|---|---|---|---|---|
| Awadhi | 41392 | 39346 | 80738 | 49.10 |
| Nepali | 26572 | 28108 | 54680 | 33.25 |
| Urdu | 5162 | 4795 | 9957 | 6.05 |
| Hindi | 4707 | 4357 | 9064 | 5.51 |
| Tharu | 2470 | 2521 | 4991 | 3.04 |
| Magar Dhut | 601 | 689 | 1290 | 0.78 |
| Newari | 610 | 647 | 1257 | 0.76 |
| Maithili | 312 | 263 | 575 | 0.35 |
| Khas | 167 | 197 | 364 | 0.22 |
| Others | 762 | 766 | 1528 | 0.93 |
| Total | 82755 | 81689 | 164444 | 100 |
Population Distribution of Male and Female by Mother Tongue
Tap bars or slices to view details
The details regarding Second Language are presented in the following table.
| Second Language | Male | Female | Total | Percentage (%) |
|---|---|---|---|---|
| No Second Language | 29007 | 31274 | 60281 | 36.66 |
| Nepali | 46047 | 42791 | 88838 | 53.97 |
| Maithili | 50 | 36 | 86 | 0.05 |
| Bhojpuri | 56 | 37 | 93 | 0.06 |
| Tharu | 85 | 64 | 149 | 0.09 |
| Newari | 17 | 21 | 38 | 0.02 |
| Magar Dhut | 76 | 100 | 176 | 0.11 |
| Urdu | 103 | 113 | 216 | 0.13 |
| Awadhi | 4255 | 4149 | 8404 | 5.11 |
| Hindi | 2707 | 2816 | 5525 | 3.36 |
| Total | 82755 | 81689 | 164444 | 100 |
Population Distribution of Male and Female by Second Language
Tap bars or slices to view details
The details regarding Ancestral Language are clarified in the following table.
| Ancestral Language | Male | Female | Total | Percentage (%) |
|---|---|---|---|---|
| Nepali | 22376 | 23568 | 45944 | 27.94 |
| Maithili | 341 | 290 | 631 | 0.38 |
| Bhojpuri | 132 | 119 | 251 | 0.15 |
| Tharu | 2679 | 2727 | 5406 | 3.29 |
| Newari | 1281 | 1370 | 2651 | 1.61 |
| Magar Dhut | 1514 | 1844 | 3358 | 2.04 |
| Urdu | 8546 | 8134 | 16680 | 10.14 |
| Awadhi | 39483 | 37494 | 76977 | 46.81 |
| Hindi | 4526 | 4110 | 8636 | 5.30 |
| Total | 82755 | 81689 | 164444 | 100 |
Population Distribution of Male and Female by Ancestral Language
Tap bars or slices to view details
Out of the total population of 164,444 in the sub-metropolitan city, the highest 76,977 i.e. 46.81 percent spoke Awadhi as their ancestral language, while 45,944 i.e. 27.94 percent spoke Nepali. Similarly, 16,680 i.e. 10.14 spoke Urdu, 8,636 i.e. 5.30 percent spoke Hindi, 3,358 i.e. 2.04 percent spoke Magar Dhut and 2,651 i.e. 1.61 percent spoke Nepal Bhasha (Newari).
(a) Indigenous: According to the National Foundation for Development of Indigenous Nationalities Act, 2058, indigenous nationalities mean 61 castes or communities having their mother tongue and traditional customs, separate cultural identity, separate social structure and written or unwritten history. Out of the total population of 164,444 of this sub-metropolitan city, 28.73 percent (47,244 people) are of the Awadhi community. Similarly, 3.7 percent Magar, 3.4 percent Tharu, 3.27 percent Kurmi, 2.79 percent Yadav, 2.68 percent Bania and 2.67 percent Brahmin-Terai communities reside in the sub-metropolitan city.
(b) Oppressed and Marginalized Communities: In Article 306 (d) under Part 34 of the Constitution of Nepal, marginalized communities mean communities that have been left behind politically, economically and socially due to discrimination and oppression and geographical remoteness and have not been able to enjoy services and facilities or are deprived of them and are in a lower position than the level of human development according to federal law. This community, which is suffering from inhumane discrimination like untouchability in the form of social discrimination, has to experience neglect in political, economic and social fields as well. Most of the people of this community are found to be living as unskilled and semi-skilled manpower by working as daily wage laborers.
3.5 Population Distribution by Religion
Religious freedom and diversity exist in Nepal. Formally, the Interim Constitution of Nepal, 2063, through the historical declaration of the reinstated Parliament on Jestha 4, 2063, declared Nepal a secular state. Similarly, the preamble of the Constitution of Nepal, 2072, expresses the resolve to preserve and promote unity in diversity, social and cultural solidarity, tolerance, and harmony by internalising multi-ethnic, multi-lingual, multi-religious, multi-cultural, and geographically diverse characteristics. It aims to end class, ethnic, regional, linguistic, religious, and gender discrimination, as well as all forms of untouchability, and to build an equitable society based on proportional inclusion and participatory principles to ensure economic equality, prosperity, and social justice. As a result, religious freedom and harmony prevail in Nepal.
As people from various communities reside in the sub-metropolitan city, they have their own festivals. For example: Dashain, Tihar, Ram Navami, Maha Shivaratri, Haritalika, Shree Panchami, Krishna Janmashtami, Holi, Chaite Dashain, Saune-Maghe Sankranti, Matatirtha Aunsi, Akshaya Tritiya, Harishayani-Haribodhini Ekadashi, Nag Panchami, Raksha Bandhan (Janai Purnima), Kushe Aunsi, Balachaturdashi, Kojagrat Purnima, Shree Swasthani Purnima, New Year, Sohra Shradha, Kul-Thani Puja, Buddha Jayanti, Chhath Parva, Eid, Lhosar, etc.
Of the total population of 164,444 in the sub-metropolitan city, 113,028 or 68.73% follow Hinduism, while the second largest group is those following Islam, numbering 48,251 or 29.34%. Similarly, 0.70% are Buddhists, 0.87% are Christians, and 0.30% follow Sikhism. Although religious diversity exists, data shows a predominance of Hindu followers. The religious tolerance that has existed for centuries in Nepal continues to be maintained in this sub-metropolitan city as well. Detailed information on various religious followers is presented in the table.
Religious Structure (Population Distribution by Religion)
Tap bars or slices to view details
| Gender | Hindu | Buddhist | Islam | Kirant | Christian | Prakriti | Bon | Jain | Wahai | Sikh | Total |
|---|---|---|---|---|---|---|---|---|---|---|---|
| Male | 56603 | 552 | 24643 | 25 | 664 | 4 | 5 | 9 | 1 | 249 | 82755 |
| Female | 56425 | 602 | 23608 | 24 | 768 | 4 | 4 | 10 | 0 | 244 | 81689 |
| Total | 113028 | 1154 | 48251 | 49 | 1432 | 8 | 9 | 19 | 1 | 493 | 164444 |
| Percent | 68.73 | 0.70 | 29.34 | 0.03 | 0.87 | 0.00 | 0.01 | 0.01 | 0.00 | 0.30 | 100 |
3.6 Population Distribution by Caste and Ethnicity
Looking at the population distribution by caste and ethnicity in the sub-metropolitan city, the highest number is 47,244 or 28.73% Muslims, second is 19,846 or 12.07% Chhetri, and third is 10,237 or 6.23% Brahmin-Hill. Similarly, Magar, Thakuri, Tharu, Kurmi, Yadav, Baniya, Brahmin-Terai, and other castes and ethnicities also reside in the sub-metropolitan city.
In such an ethnically diverse society, locals are found to live with social harmony. It is necessary to formulate programs to preserve the original culture, tradition, language, and lifestyle of various castes and ethnicities, including the marginalized castes of Nepal who have their own distinct language, culture, and lifestyle, and to maintain their identity. Detailed information is presented in the table below.
| Caste/Ethnicity | Male | Female | Total | Percentage |
|---|---|---|---|---|
| Muslim | 24240 | 23004 | 47244 | 28.73 |
| Chhetri | 9765 | 10081 | 19846 | 12.07 |
| Brahmin-Hill | 5099 | 5138 | 10237 | 6.23 |
| Thakuri | 3390 | 3664 | 7054 | 4.29 |
| Magar | 2761 | 3307 | 6068 | 3.69 |
| Tharu | 2774 | 2831 | 5605 | 3.41 |
| Kurmi | 2803 | 2580 | 5383 | 3.27 |
| Yadav | 2403 | 2181 | 4584 | 2.79 |
| Baniya | 2319 | 2089 | 4408 | 2.68 |
| Brahmin-Terai | 2316 | 2072 | 4388 | 2.67 |
| Others | 24885 | 24742 | 49627 | 30.18 |
| Total | 82755 | 81689 | 164444 | 100 |
Note: Others include Tamang, Newar, Vishwakarma, Rai, Gurung, Pariyar, Yakthung/Limbu, Mijar, Teli, Chamar/Harijan/Ram, Koiri, Mushar, Sanyasi, Dhanuka, Paswan, Mallah, Kewat, Kathwaniya, Kalwar, Kanu, Kumal, Gharti/Bhujel, Hajam/Thakur, Sherpa, Dhobi, Tatma, Lohar, Halwai, Majhi, Barai, Nunia, Chepang, Sonar, Komar, Sunuwar, Kahar, Santhel, Marwari, Kayastha, Rajput, Badi, Kunduk, Lodh, Badhai, Bengali, Dhimal, Mali, Dhunia, Bhote, Dom, Thakali, Kori, Punjabi/Sikh, Meche, Raji, Kuswadia, Dev, Chidimar, Ranatharu, Gond, Kattik, and other castes and ethnicities.
3.7 Household Head Details
The classification of household heads, who serve as the main person of the household in this sub-metropolitan city, is shown in the table and chart below.
| Description | Male | Female | Total | Percentage |
|---|---|---|---|---|
| Number of Household Heads | 23974 | 10831 | 34805 | 100 |
| Percentage | 68.88 | 31.12 | 100 | - |
Out of the 34,805 households in the sub-metropolitan city, 23,974 households have male heads, which accounts for 68.88% of the total households, while 10,831 households have female heads, which accounts for 31.12% of the total households. Therefore, it appears that the number of male household heads is higher in this sub-metropolitan city.
The distribution of household heads by age and gender is as follows:
| Age Group | Male Household Head | Female Household Head | Total Households |
|---|---|---|---|
| 10-14 | 23 | 14 | 37 |
| 15-19 | 342 | 267 | 609 |
| 20-29 | 2998 | 1765 | 4763 |
| 30-39 | 6228 | 2385 | 8613 |
| 40-49 | 6771 | 1794 | 8565 |
| 50-59 | 4911 | 1150 | 6061 |
| 60-69 | 2922 | 857 | 3779 |
| 70 Above | 1538 | 560 | 2098 |
| Total | 25773 | 8792 | 34565 |
Out of the total 34,565 households in the sub-metropolitan city, 25,773 or 74.56% have male household heads, while 8,792 or 25.44% have female household heads.
3.8 Population Distribution by Occupation
Out of the total population in the age group of 10 to 65+ years in the sub-metropolitan city, workers in elementary occupations are the highest at 27,635 or 40.18%. Skilled agricultural workers are the second highest at 10,257 or 14.91%. The detailed breakdown by age group is presented in the table below.
| Occupation | 10-14 | 15-19 | 20-24 | 25-29 | 30-34 | 35-39 | 40-44 | 45-49 | 50-54 | 55-59 | 60-64 | 65+ | Total | Percentage |
|---|---|---|---|---|---|---|---|---|---|---|---|---|---|---|
| Armed Forces Officers | 0 | 2 | 16 | 40 | 57 | 105 | 58 | 29 | 17 | 4 | 0 | 0 | 328 | 0.48 |
| Managers | 0 | 13 | 362 | 721 | 1057 | 1209 | 1156 | 865 | 722 | 401 | 246 | 225 | 7065 | 10.27 |
| Professionals | 2 | 40 | 304 | 547 | 615 | 587 | 491 | 371 | 309 | 187 | 71 | 83 | 3607 | 5.24 |
| Technicians/Associate Professionals | 4 | 41 | 295 | 491 | 390 | 290 | 212 | 116 | 173 | 86 | 26 | 40 | 2332 | 3.39 |
| Clerical Support Workers | 2 | 44 | 262 | 341 | 318 | 281 | 201 | 143 | 114 | 60 | 22 | 28 | 1816 | 2.64 |
| Service and Sales Workers | 13 | 248 | 787 | 1017 | 1014 | 1146 | 982 | 667 | 487 | 323 | 114 | 230 | 7246 | 10.53 |
| Skilled Agricultural Workers | 511 | 774 | 1138 | 1048 | 1072 | 1146 | 1029 | 868 | 836 | 655 | 510 | 670 | 10257 | 14.91 |
| Craft and Related Trades Workers | 0 | 440 | 940 | 995 | 859 | 836 | 646 | 430 | 348 | 198 | 110 | 101 | 5903 | 8.58 |
| Plant & Machine Operators | 2 | 93 | 283 | 402 | 419 | 337 | 339 | 233 | 156 | 73 | 44 | 31 | 2452 | 3.57 |
| Elementary Occupations | 3120 | 3661 | 3764 | 3375 | 2894 | 2747 | 2231 | 1674 | 1286 | 866 | 748 | 1269 | 27635 | 40.18 |
| Economically Inactive | 18 | 12 | 14 | 12 | 17 | 8 | 14 | 6 | 1 | 3 | 1 | 3 | 109 | 0.16 |
| Total | 3672 | 5456 | 8165 | 9077 | 8712 | 8712 | 7419 | 5422 | 4441 | 2856 | 1972 | 2680 | 68772 | 100 |
Population Distribution by Occupation (Total)
Tap bars or slices to view details
3.9 Economically Active Population Distribution
The detailed distribution of the population aged 10 and above according to the duration (months) of economic work performed in the 12 months prior to the census is presented in the table below.
| Gender | Less than 3 months | 3 months or more | 6 months or more | Did not work | Total |
|---|---|---|---|---|---|
| Male | 3900 | 3791 | 35046 | 23712 | 66449 |
| Female | 7859 | 7115 | 11053 | 41193 | 67220 |
| Total | 11759 | 10914 | 46099 | 64905 | 133677 |
| Percentage | 8.8 | 8.2 | 34.5 | 48.6 | 100 |
Population Distribution by Economic Work Duration (12 months)
Tap bars or slices to view details
| Gender | Economically Active | Economically Inactive | Total |
|---|---|---|---|
| Male | 37820 | 7310 | 45130 |
| Female | 14122 | 15047 | 29169 |
| Total | 51942 | 22357 | 74299 |
| Percentage | 69.91 | 30.09 | 100 |
Status of Economically Active and Inactive Population
Tap bars or slices to view details
The distribution of children in the 10-17 age group based on their economic activity and employment status is presented in the table below.
| Age Group | Employment | Self-employed | Contributing Family Member | Not Stated | Total |
|---|---|---|---|---|---|
| 10-12 years | 347 | 534 | 1212 | 6 | 2099 |
| 13-15 years | 557 | 680 | 1204 | 3 | 2444 |
| 16-17 years | 684 | 502 | 757 | 2 | 1945 |
| Total | 1588 | 1716 | 3173 | 11 | 6488 |
| Percentage | 24.48 | 26.45 | 48.91 | 0.17 | 100 |
Children's Economic Activity and Employment Status
Tap bars or slices to view details
3.10 Reasons for Economic Inactivity
Out of the total population in the age group of 10 to 75+ years in the sub-metropolitan city, the most common reason for working less than 6 months is being a student (26,979 or 30.78%). The second most common reason is household work (22,708 or 25.91%). The detailed breakdown by age group is presented in the table below.
| Age Group | Student | Household Work | Family Care | Old Age | Disabled | Pension | Social/Religious | Others | Not Stated | Total |
|---|---|---|---|---|---|---|---|---|---|---|
| 10-14 years | 11972 | 609 | 134 | 0 | 35 | 0 | 0 | 3743 | 54 | 16547 |
| 15-19 years | 9787 | 1578 | 353 | 0 | 52 | 3 | 3 | 3954 | 74 | 15804 |
| 20-24 years | 4218 | 3292 | 806 | 0 | 70 | 3 | 17 | 3647 | 83 | 12136 |
| 25-29 years | 843 | 3723 | 1003 | 0 | 53 | 7 | 23 | 2691 | 63 | 8406 |
| 30-34 years | 109 | 3226 | 895 | 0 | 62 | 16 | 20 | 1988 | 29 | 6345 |
| 35-39 years | 31 | 2985 | 809 | 0 | 56 | 48 | 18 | 1680 | 35 | 5662 |
| 40-44 years | 11 | 2221 | 679 | 0 | 62 | 58 | 19 | 1298 | 39 | 4397 |
| 45-49 years | 2 | 1792 | 530 | 0 | 73 | 53 | 20 | 1035 | 23 | 3528 |
| 50-54 years | 4 | 1398 | 416 | 0 | 113 | 108 | 20 | 1044 | 27 | 3130 |
| 55-59 years | 1 | 979 | 300 | 0 | 78 | 191 | 22 | 918 | 25 | 2514 |
| 60-64 years | 0 | 629 | 195 | 806 | 90 | 278 | 15 | 677 | 10 | 2700 |
| 65-69 years | 0 | 172 | 76 | 1308 | 84 | 231 | 2 | 412 | 4 | 2289 |
| 70-74 years | 0 | 73 | 33 | 1480 | 73 | 239 | 4 | 376 | 4 | 2282 |
| 75+ years | 1 | 31 | 12 | 1333 | 46 | 157 | 3 | 265 | 0 | 1848 |
| Total | 26979 | 22708 | 6241 | 4927 | 947 | 1392 | 186 | 23808 | 470 | 87658 |
| Percentage | 30.78 | 25.91 | 7.12 | 5.62 | 1.08 | 1.59 | 0.21 | 27.16 | 0.54 | 100 |
3.11 Population Distribution by Disability
Disability is defined as a state of difficulty in carrying out daily activities normally and fully participating in social life due to physical, social, and cultural barriers, as well as communication barriers created by problems in body parts and physical systems. Common causes of disability in individuals include lack of iodized salt consumption, Trachoma caused by not washing faces in rural areas, accidents, congenital conditions, natural disasters, malnutrition, lack of medical treatment, conflict or war, or the use of explosives. Both preventive and curative measures must be taken to reduce these. To protect, promote, and develop the rights, interests, and privileges of persons and children with disabilities, the Disabled Protection and Welfare Act, 2039 BS (1982) covering 19 areas, and the National Plan of Action on Disability, 2063 BS (2006) have been formulated and implemented. Similarly, Nepal ratified the United Nations Convention on the Rights of Persons with Disabilities, 2006 on December 27, 2009 (Poush 12, 2066 BS).
a) Population Distribution by Type of Disability
For the distribution of disability identity cards, persons with disabilities are classified into seven types based on disability: physical disability, blindness and low vision, speech-related disability, hard of hearing and deaf, deaf-blindness, mental disability, intellectual disability, and multiple disabilities. Furthermore, based on severity, the identity card distribution has been initiated by dividing them into four categories: Category A (Red Identity Card), Category B (Blue Identity Card), Category C (Yellow Identity Card), and Category D (White Identity Card).
Although some basic income-generating and skill-oriented training has been conducted so far to bring changes to the socio-economic status of this community, it is evident that various programs need to be implemented to increase their self-confidence, free them from community neglect, and provide them access to local resources and bodies. According to the National Census 2021 data, out of the total population in the sub-metropolitan city, 2,658 persons have disabilities. Among them, 1,025 have physical disabilities, and 411 have low vision. Similarly, there are 184 persons with blindness, 154 with deafness, 113 who are hard of hearing, 53 with deaf-blindness, 130 with speech-related disabilities, 144 with mental disabilities, 104 with intellectual disabilities, 19 with hemophilia, 34 with autism, 241 with multiple disabilities, and 46 whose disability is not stated. The detailed breakdown is presented below:
| Age Group | Physical | Low Vision | Blind | Deaf | Hard of Hearing | Deaf-Blind | Speech | Mental | Intellectual | Hemophilia | Autism | Multiple | Others | Total |
|---|---|---|---|---|---|---|---|---|---|---|---|---|---|---|
| 0-4 years | 71 | 5 | 34 | 3 | 3 | 2 | 6 | 1 | 5 | 1 | 9 | 12 | 4 | 156 |
| 5-9 years | 85 | 11 | 31 | 10 | 4 | 2 | 13 | 5 | 16 | 1 | 8 | 18 | 2 | 206 |
| 10-14 years | 62 | 6 | 14 | 13 | 4 | 2 | 15 | 9 | 7 | 1 | 3 | 16 | 1 | 153 |
| 15-19 years | 89 | 23 | 22 | 17 | 12 | 1 | 15 | 23 | 14 | 0 | 3 | 23 | 6 | 248 |
| 20-24 years | 70 | 13 | 14 | 4 | 8 | 4 | 12 | 18 | 16 | 1 | 4 | 20 | 5 | 189 |
| 25-29 years | 66 | 12 | 7 | 7 | 3 | 0 | 6 | 17 | 10 | 1 | 1 | 18 | 4 | 152 |
| 30-34 years | 80 | 11 | 9 | 9 | 3 | 3 | 15 | 16 | 11 | 1 | 1 | 11 | 6 | 184 |
| 35-39 years | 58 | 13 | 5 | 9 | 5 | 3 | 7 | 16 | 7 | 1 | 1 | 21 | 4 | 150 |
| 40-44 years | 74 | 17 | 6 | 4 | 4 | 4 | 8 | 12 | 7 | 3 | 1 | 12 | 4 | 156 |
| 45-49 years | 53 | 18 | 10 | 5 | 6 | 1 | 5 | 5 | 3 | 3 | 0 | 15 | 4 | 128 |
| 50-54 years | 51 | 45 | 7 | 7 | 10 | 3 | 7 | 12 | 2 | 2 | 1 | 8 | 2 | 157 |
| 55-59 years | 48 | 36 | 5 | 4 | 11 | 3 | 1 | 2 | 1 | 1 | 0 | 8 | 1 | 121 |
| 60-64 years | 64 | 52 | 3 | 16 | 14 | 2 | 3 | 3 | 3 | 0 | 0 | 14 | 1 | 175 |
| 65-69 years | 57 | 47 | 11 | 14 | 9 | 4 | 6 | 4 | 2 | 1 | 0 | 9 | 1 | 165 |
| 70-74 years | 63 | 50 | 2 | 15 | 10 | 14 | 6 | 0 | 0 | 0 | 2 | 17 | 1 | 180 |
| 75+ years | 34 | 44 | 4 | 17 | 7 | 5 | 5 | 1 | 0 | 2 | 0 | 19 | 0 | 138 |
| Total | 1025 | 411 | 184 | 154 | 113 | 53 | 130 | 144 | 104 | 19 | 34 | 241 | 46 | 2658 |
| Percentage | 38.56 | 15.46 | 6.92 | 5.79 | 4.25 | 1.99 | 4.89 | 5.42 | 3.91 | 0.71 | 1.28 | 9.07 | 1.73 | 100 |
3.12 Migration Details
Out of the total population of 164,444 in Nepalgunj Sub-metropolitan City, 153,577 people were born in Nepal. Among those born in Nepal, 117,480 were born within this sub-metropolitan city, 6,289 in other local levels of Banke district, 30,808 in other districts, 9,835 were born abroad and currently reside in this city, and for 32 people, the birthplace was not disclosed.
| Age Group | Born in Nepal | Within City | Other Mun. | Hill | Mountain | Terai | Not Stated | Born Abroad | Not Disclosed | Total Pop. |
|---|---|---|---|---|---|---|---|---|---|---|
| 0-4 years | 13918 | 13556 | 66 | 36 | 139 | 121 | 0 | 75 | 1 | 13994 |
| 5-9 years | 16445 | 15308 | 161 | 205 | 412 | 379 | 0 | 146 | 2 | 16593 |
| 10-14 years | 16627 | 14591 | 217 | 371 | 824 | 544 | 0 | 185 | 1 | 16813 |
| 15-19 years | 17398 | 13863 | 542 | 500 | 1314 | 1179 | 0 | 344 | 5 | 17747 |
| 20-24 years | 16233 | 11522 | 909 | 504 | 1576 | 1722 | 0 | 959 | 2 | 17194 |
| 25-29 years | 13677 | 9530 | 835 | 390 | 1398 | 1524 | 0 | 1338 | 2 | 15017 |
| 30-34 years | 11892 | 7811 | 793 | 401 | 1464 | 1422 | 1 | 1276 | 0 | 13168 |
| 35-39 years | 11211 | 7336 | 734 | 310 | 1448 | 1383 | 0 | 1306 | 3 | 12520 |
| 40-44 years | 9353 | 6017 | 553 | 245 | 1353 | 1184 | 1 | 998 | 4 | 10355 |
| 45-49 years | 7031 | 4543 | 428 | 189 | 1040 | 830 | 1 | 818 | 4 | 7853 |
| 50-54 years | 5986 | 3754 | 331 | 158 | 1108 | 634 | 1 | 615 | 3 | 6604 |
| 55-59 years | 4211 | 2768 | 195 | 108 | 807 | 333 | 0 | 525 | 3 | 4739 |
| 60-64 years | 3550 | 2316 | 143 | 112 | 742 | 236 | 1 | 419 | 2 | 3971 |
| 64-69 years | 2712 | 1789 | 141 | 75 | 551 | 155 | 1 | 342 | 0 | 3054 |
| 70-74 years | 2434 | 1663 | 87 | 87 | 465 | 132 | 0 | 282 | 0 | 2716 |
| 75+ years | 1799 | 1113 | 74 | 57 | 476 | 79 | 0 | 207 | 0 | 2006 |
| Total | 153577 | 117480 | 6289 | 3748 | 15197 | 11857 | 6 | 9835 | 32 | 164444 |
Based on the previous place of residence in the last 12 months, out of the total population of 164,444 in the sub-metropolitan city, the highest number, 116,726 (71.0%), are residing in this very municipality, while 8,499 (5.2%) have migrated from other local levels within the same district. Similarly, the number of persons migrating from other districts is 29,429 (17.9%), and those migrating from abroad stands at 9,790 (6.0%).
| Migration Type | Male | Female | Total | Percentage |
|---|---|---|---|---|
| Within this Sub-metropolitan | 65069 | 51657 | 116726 | 71.0 |
| Other Local Level in this District | 2695 | 5804 | 8499 | 5.2 |
| Other District | 13536 | 15893 | 29429 | 17.9 |
| Foreign Country | 1455 | 8335 | 9790 | 6.0 |
| Total | 82755 | 81689 | 164444 | 100 |
Population Distribution of Migrants by Previous Place of Residence
3.13 Registration of Personal Incidents
Citizens must follow legal procedures to exercise their personal rights. To obtain citizenship, passports, or other identity cards, and to engage in employment, enterprise, or travel abroad, certain legal processes must be completed. For this, the government provides official certificates. Events such as birth, death, migration, marriage, and divorce must be registered in a timely manner. The Constitution has guaranteed various rights to citizens. The starting point for this is the registration of personal incidents. It is universally recognized that national statistics are compiled based on the registration of these personal incidents. Where? How many were born? How many died? How many migrated? How many got divorced? The state must have information about such matters. Since the government formulates service delivery policies based on this, it seems necessary to raise public awareness to register personal incidents in a timely manner.
a) Population Distribution According to Birth Registration of Children Under 5 Years
| Province/District/Local Level | Registration Status | Boy | Girl | Total | Percentage |
|---|---|---|---|---|---|
| Lumbini | Total | 28386 | 25723 | 54109 | 100 |
| Registered | 20443 | 18485 | 38928 | 71.93 | |
| Not Registered | 7943 | 7238 | 15181 | 28.05 | |
| Banke | Total | 3581 | 3184 | 6765 | 100 |
| Registered | 2517 | 2182 | 4699 | 69.39 | |
| Not Registered | 1074 | 993 | 2077 | 30.60 | |
| Nepalgunj Sub-metropolitan | Total | 9217 | 8311 | 17528 | 100 |
| Registered | 5772 | 5069 | 10841 | 61.85 | |
| Not Registered | 3445 | 3242 | 6687 | 38.15 |
Birth Registration Status of Children Under 5 Years
Tap bars or slices to view details
b) Ward-wise Distribution of Children Under 5 Years Based on Birth Registration
| Ward | Birth Reg. | Boy | Girl | Total |
|---|---|---|---|---|
| 1 | Total | 385 | 331 | 716 |
| Yes | 212 | 193 | 405 | |
| No | 173 | 138 | 311 | |
| 2 | Total | 281 | 239 | 520 |
| Yes | 185 | 172 | 357 | |
| No | 96 | 67 | 163 | |
| 3 | Total | 172 | 152 | 324 |
| Yes | 82 | 80 | 162 | |
| No | 90 | 72 | 162 | |
| 4 | Total | 627 | 557 | 1184 |
| Yes | 409 | 346 | 755 | |
| No | 218 | 211 | 429 | |
| 5 | Total | 340 | 293 | 633 |
| Yes | 185 | 135 | 320 | |
| No | 155 | 158 | 313 | |
| 6 | Total | 297 | 263 | 560 |
| Yes | 181 | 148 | 329 | |
| No | 116 | 115 | 231 | |
| 7 | Total | 159 | 139 | 298 |
| Yes | 98 | 84 | 182 | |
| No | 61 | 55 | 116 | |
| 8 | Total | 225 | 211 | 436 |
| Yes | 168 | 146 | 314 | |
| No | 57 | 65 | 122 | |
| 9 | Total | 237 | 207 | 444 |
| Yes | 157 | 140 | 297 | |
| No | 80 | 67 | 147 | |
| 10 | Total | 353 | 305 | 658 |
| Yes | 229 | 205 | 434 | |
| No | 124 | 100 | 224 | |
| 11 | Total | 296 | 249 | 545 |
| Yes | 180 | 153 | 333 | |
| No | 116 | 96 | 212 | |
| 12 | Total | 337 | 272 | 609 |
| Yes | 227 | 180 | 407 | |
| No | 110 | 92 | 202 | |
| 13 | Total | 403 | 425 | 828 |
| Yes | 249 | 261 | 510 | |
| No | 154 | 164 | 318 | |
| 14 | Total | 473 | 490 | 963 |
| Yes | 275 | 292 | 567 | |
| No | 198 | 198 | 396 | |
| 15 | Total | 466 | 445 | 911 |
| Yes | 227 | 195 | 422 | |
| No | 239 | 250 | 489 | |
| 16 | Total | 568 | 536 | 1104 |
| Yes | 298 | 277 | 575 | |
| No | 270 | 259 | 529 | |
| 17 | Total | 404 | 312 | 716 |
| Yes | 274 | 198 | 472 | |
| No | 130 | 114 | 244 | |
| 18 | Total | 656 | 513 | 1169 |
| Yes | 464 | 338 | 802 | |
| No | 192 | 175 | 367 | |
| 19 | Total | 513 | 465 | 978 |
| Yes | 349 | 304 | 653 | |
| No | 164 | 161 | 325 | |
| 20 | Total | 835 | 723 | 1558 |
| Yes | 544 | 467 | 1011 | |
| No | 291 | 256 | 547 | |
| 21 | Total | 571 | 584 | 1155 |
| Yes | 412 | 397 | 809 | |
| No | 159 | 187 | 346 | |
| 22 | Total | 436 | 419 | 855 |
| Yes | 214 | 226 | 440 | |
| No | 222 | 193 | 415 | |
| 23 | Total | 163 | 181 | 344 |
| Yes | 110 | 127 | 237 | |
| No | 53 | 54 | 107 | |
| Total | Total | 9217 | 8311 | 17528 |
| Yes | 5772 | 5069 | 10841 | |
| No | 3445 | 3242 | 6687 |
Ward-wise Distribution of Children Under 5 Years Based on Birth Registration
Tap bars or slices to view details
c) Details Regarding Deaths in the Last 12 Months
Out of the total population of 164,444 in this sub-metropolitan city, 1,077 deaths occurred in the last 12 months. This includes 615 males (57.10%) and 462 females (42.90%). The highest number of deaths was recorded in the age group of 80 years and above, with 155 deaths.
| Age Group of Deceased | Male | Female | Total |
|---|---|---|---|
| 1 year | 61 | 33 | 94 |
| 1-4 years | 14 | 14 | 28 |
| 5-9 years | 7 | 5 | 12 |
| 10-14 years | 5 | 3 | 8 |
| 15-19 years | 11 | 5 | 16 |
| 20-24 years | 18 | 9 | 27 |
| 25-29 years | 24 | 12 | 36 |
| 30-34 years | 17 | 12 | 29 |
| 35-39 years | 25 | 19 | 44 |
| 40-44 years | 33 | 15 | 48 |
| 45-49 years | 40 | 22 | 62 |
| 50-54 years | 42 | 31 | 73 |
| 55-59 years | 34 | 48 | 82 |
| 60-64 years | 46 | 27 | 73 |
| 65-69 years | 51 | 41 | 92 |
| 70-74 years | 71 | 53 | 124 |
| 75-79 years | 37 | 36 | 73 |
| 80 and above | 78 | 77 | 155 |
| Not stated | 1 | 0 | 1 |
| Total | 615 | 462 | 1077 |
Details of Deceased by Age Group
Tap bars or slices to view details
d) Number of Deceased by Cause of Death
| Cause of Death | Number | Percentage |
|---|---|---|
| Non-communicable disease | 457 | 42.43 |
| Communicable disease | 216 | 20.06 |
| Other causes | 200 | 18.57 |
| Natural disaster | 79 | 7.33 |
| Other accidents | 67 | 6.22 |
| Road accident | 16 | 1.48 |
| Suicide | 14 | 1.30 |
| Maternal death | 9 | 0.84 |
| Murder | 2 | 0.19 |
| Not stated | 17 | 1.58 |
| Total | 1077 | 100 |
Economic Status
Economic description, land use, agriculture, tourism, and industry
4.1 Major Economic Description
The foundations of economic prosperity are the main economic activities taking place in the sub-metropolitan city. The more intense the economic activities become, the more dynamic and robust the sub-metropolitan city's economy becomes. Mainly, the Nepali economy is centered around agriculture, tourism, small and cottage industries, foreign employment, banking, trade, service sector, etc. In the absence of the development of high-tech based international level industries, most of the economic activities remain subsistence-oriented.
4.1.1 Population by Economic Work and Industrial Sector
| Sector of Economic Work or Industry | Duration of Work | |||
|---|---|---|---|---|
| 6 Months or More | 3 to 5 Months | 1 to 2 Months | Total | |
| Agriculture, Forestry and Animal Husbandry | 8,246 | 3,578 | 3,463 | 15,287 |
| Mining and Quarrying | 116 | 11 | 4 | 131 |
| Industrial Manufacturing | 3,969 | 179 | 43 | 4,191 |
| Electricity, Gas, Steam and Air Conditioning Supply | 329 | 13 | 2 | 344 |
| Water Supply, Sewerage, Waste Management | 329 | 14 | 13 | 356 |
| Construction | 6,129 | 1,795 | 1,929 | 9,853 |
| Wholesale and Retail Trade | 10,010 | 3,180 | 4,174 | 17,364 |
| Transportation and Storage | 3,335 | 78 | 18 | 3,431 |
| Accommodation and Food Service Activities | 2,131 | 75 | 22 | 2,228 |
| Information and Communication | 375 | 6 | 8 | 389 |
| Real Estate Activities | 1,323 | 13 | 7 | 1,343 |
| Veterinary and Animal Health Activities | 183 | 3 | 1 | 187 |
| Professional, Scientific and Technical Activities | 622 | 14 | 4 | 640 |
| Administrative and Support Service Activities | 243 | 8 | 1 | 252 |
| Public Administration and Defense Activities | 1,704 | 16 | 7 | 1,727 |
| Education Activities | 2,571 | 44 | 15 | 2,630 |
| Human Health and Social Work Activities | 1,743 | 25 | 10 | 1,778 |
| Arts, Entertainment and Recreation | 310 | 9 | 7 | 326 |
| Other | 1,135 | 1,501 | 1,844 | 4,480 |
| Household Domestic Activities | 1,051 | 336 | 185 | 1,572 |
| Activities of Extraterritorial Organizations and Bodies | 178 | 2 | 1 | 181 |
| Not Stated | 67 | 14 | 1 | 82 |
| Total | 46,099 | 10,914 | 11,759 | 68,772 |
Out of the total population aged 10 years and above in the sub-metropolitan city, 68,772 people are engaged in some kind of economic activity and earning income. Among them, the highest number, 17,364 people, are engaged in wholesale and retail trade activities. Similarly, there are 15,287 people engaged in agriculture, forestry, and animal husbandry. Furthermore, the number of people engaged in activities earning income for more than 6 months is 46,099, those engaged in economic activities for only 1 to 2 months is 11,759, and those engaged in economic activities for only 3 to 5 months is 10,914. Detailed descriptions of this are presented in the table.
4.1.2 Housing Structure Description
A) Description of Households Based on Home Ownership
In this sub-metropolitan city, 4 types of housing structures are found to be used based on home ownership. 26,860 households, or 77.71 percent, reside in privately owned homes. Similarly, the number of those living in rented accommodations is 7,130, or 20.63 percent. 394 families, or 1.14 percent, live in institutional houses, while 181 households, or 0.52 percent, live in houses with an unspecified ownership status. Since Nepal is sensitive from a seismic point of view, it is necessary to make houses earthquake-resistant when constructing them. If the government ensures the right to housing security for extremely poor families by building integrated settlements, the welfare role of the state is affirmed.
| Ward No. | Private | Rented | Institutional | Other (To be specified) | Total |
|---|---|---|---|---|---|
| 1 | 1,481 | 673 | 6 | 7 | 2,167 |
| 2 | 825 | 508 | 14 | 16 | 1,363 |
| 3 | 511 | 37 | 6 | 2 | 556 |
| 4 | 1,736 | 1,136 | 20 | 26 | 2,918 |
| 5 | 933 | 195 | 4 | 5 | 1,137 |
| 6 | 1,090 | 309 | 10 | 2 | 1,411 |
| 7 | 542 | 125 | 6 | 9 | 682 |
| 8 | 733 | 111 | 6 | 2 | 852 |
| 9 | 831 | 552 | 27 | 15 | 1,425 |
| 10 | 1,401 | 1,102 | 151 | 9 | 2,663 |
| 11 | 851 | 141 | 3 | 6 | 1,001 |
| 12 | 1,228 | 474 | 27 | 9 | 1,738 |
| 13 | 1,238 | 185 | 40 | 3 | 1,466 |
| 14 | 995 | 56 | 2 | 3 | 1,056 |
| 15 | 1,057 | 62 | 1 | 25 | 1,145 |
| 16 | 1,045 | 47 | 3 | 5 | 1,100 |
| 17 | 1,156 | 63 | 1 | 0 | 1,220 |
| 18 | 2,207 | 467 | 25 | 3 | 2,702 |
| 19 | 1,531 | 169 | 6 | 5 | 1,711 |
| 20 | 2,654 | 598 | 29 | 17 | 3,298 |
| 21 | 1,523 | 26 | 2 | 2 | 1,553 |
| 22 | 966 | 94 | 1 | 5 | 1,066 |
| 23 | 326 | 0 | 4 | 5 | 335 |
| Total | 26,860 | 7,130 | 394 | 181 | 34,565 |
| Percentage | 77.71 | 20.63 | 1.14 | 0.52 | 100 |
Household Details by Home Ownership
Household Details by Home Ownership
Tap bars or slices to view details
B) Number of Households Based on Women's Ownership of House and Land
| Women's Ownership | House Only | Land Only | Both | Neither | Not Specified | Total |
|---|---|---|---|---|---|---|
| Total | 1,389 | 2,838 | 5,017 | 24,303 | 1,018 | 34,565 |
| Percentage | 4.02 | 8.21 | 14.51 | 70.31 | 2.95 | 100 |
Population By Women's Ownership
Population By Women's Ownership
Tap bars or slices to view details
C) Living Conditions of Children Under 18 Years of Age
| Age Group | Mother & Father | Mother Only | Father Only | Father & Stepmom | Mother & Stepdad | Other Relatives | Employer | Other | Not Specified | Total |
|---|---|---|---|---|---|---|---|---|---|---|
| Under 1 yr | 2,376 | 118 | 3 | 2 | 0 | 10 | 0 | 0 | 1 | 2,510 |
| 1-4 yrs | 10,521 | 822 | 48 | 15 | 2 | 71 | 0 | 1 | 4 | 11,484 |
| 5-9 yrs | 14,914 | 1,343 | 121 | 29 | 7 | 268 | 0 | 1 | 10 | 16,693 |
| 10-14 yrs | 14,479 | 1,539 | 168 | 51 | 10 | 518 | 10 | 22 | 16 | 16,813 |
| 15-17 yrs | 8,214 | 961 | 167 | 39 | 5 | 666 | 12 | 85 | 38 | 10,187 |
| Total | 50,504 | 4,783 | 507 | 136 | 24 | 1,533 | 22 | 109 | 69 | 57,687 |
| Percentage | 87.55 | 8.29 | 0.88 | 0.24 | 0.04 | 2.66 | 0.04 | 0.19 | 0.12 | 100 |
Living Arrangement Of Children Under 18 Years
Living Arrangement Of Children Under 18 Years
Tap bars or slices to view details
Out of the total population of children under 18 years of age in the sub-metropolitan city, 50,504, or 87.55 percent, live with their mother and father, while 4,783, or 8.29 percent, live only with their mother, and 507, or 0.88 percent, live only with their father. Additionally, 1,533, or 2.66 percent, of the children live with other relatives, 136, or 0.24 percent, live with their father and stepmother, and 24, or 0.04 percent, live with their mother and stepfather. The detailed description of this is presented in the table above.
D) Details of Households Based on Foundation
| Ward No. | Mud Bonded Bricks/Stones | Cement Bonded Bricks/Stones | RCC Pillars | Wooden Pillars | Other | Total |
|---|---|---|---|---|---|---|
| 1 | 169 | 1,122 | 861 | 7 | 0 | 2,167 |
| 2 | 80 | 339 | 928 | 11 | 5 | 1,363 |
| 3 | 66 | 434 | 54 | 1 | 1 | 556 |
| 4 | 352 | 1,177 | 1,423 | 13 | 23 | 2,918 |
| 5 | 209 | 674 | 252 | 2 | 0 | 1,137 |
| 6 | 207 | 516 | 684 | 4 | 0 | 1,411 |
| 7 | 58 | 434 | 188 | 1 | 1 | 682 |
| 8 | 76 | 704 | 70 | 2 | 0 | 852 |
| 9 | 168 | 739 | 508 | 9 | 1 | 1,425 |
| 10 | 302 | 1,506 | 850 | 2 | 3 | 2,663 |
| 11 | 135 | 696 | 168 | 2 | 0 | 1,001 |
| 12 | 143 | 660 | 930 | 4 | 1 | 1,738 |
| 13 | 548 | 826 | 89 | 3 | 0 | 1,466 |
| 14 | 487 | 278 | 170 | 7 | 114 | 1,056 |
| 15 | 610 | 385 | 87 | 32 | 31 | 1,145 |
| 16 | 371 | 499 | 225 | 4 | 1 | 1,100 |
| 17 | 373 | 727 | 49 | 1 | 0 | 1,220 |
| 18 | 276 | 1,606 | 805 | 12 | 3 | 2,702 |
| 19 | 506 | 768 | 430 | 4 | 3 | 1,711 |
| 20 | 1,036 | 1,559 | 606 | 73 | 24 | 3,298 |
| 21 | 638 | 774 | 98 | 34 | 9 | 1,553 |
| 22 | 368 | 401 | 224 | 3 | 70 | 1,066 |
| 23 | 69 | 91 | 47 | 6 | 122 | 335 |
| Total | 7,247 | 16,915 | 9,754 | 237 | 412 | 34,565 |
| Percentage | 20.97 | 48.94 | 28.22 | 0.69 | 1.19 | 100 |
Household Details Based on Foundation
Household Details Based on Foundation
Tap bars or slices to view details
E) Details of Households Based on Outer Wall
| Ward No. | Mud bonded bricks/stones | Cement bonded bricks/stones | Wood | Bamboo | Unbaked Bricks | Galvanized Sheet | Prefabricated Sheet | Other | Total |
|---|---|---|---|---|---|---|---|---|---|
| 1 | 157 | 1,992 | 5 | 0 | 6 | 7 | 0 | 0 | 2,167 |
| 2 | 53 | 1,284 | 5 | 7 | 0 | 14 | 0 | 0 | 1,363 |
| 3 | 66 | 485 | 0 | 3 | 0 | 2 | 0 | 0 | 556 |
| 4 | 314 | 2,564 | 5 | 1 | 0 | 12 | 0 | 22 | 2,918 |
| 5 | 195 | 937 | 2 | 0 | 0 | 2 | 0 | 1 | 1,137 |
| 6 | 193 | 1,206 | 6 | 0 | 0 | 1 | 0 | 5 | 1,411 |
| 7 | 37 | 642 | 1 | 0 | 0 | 2 | 0 | 0 | 682 |
| 8 | 74 | 773 | 3 | 1 | 1 | 0 | 0 | 0 | 852 |
| 9 | 186 | 1,226 | 1 | 0 | 9 | 3 | 0 | 0 | 1,425 |
| 10 | 138 | 2,508 | 11 | 0 | 0 | 3 | 0 | 3 | 2,663 |
| 11 | 111 | 879 | 2 | 1 | 0 | 0 | 0 | 0 | 1,001 |
| 12 | 139 | 1,579 | 7 | 3 | 2 | 2 | 0 | 6 | 1,738 |
| 13 | 505 | 944 | 9 | 1 | 4 | 2 | 1 | 0 | 1,466 |
| 14 | 430 | 498 | 2 | 7 | 66 | 3 | 0 | 50 | 1,056 |
| 15 | 464 | 565 | 4 | 35 | 62 | 1 | 0 | 14 | 1,145 |
| 16 | 328 | 759 | 8 | 1 | 1 | 2 | 0 | 1 | 1,100 |
| 17 | 366 | 830 | 1 | 0 | 1 | 3 | 0 | 19 | 1,220 |
| 18 | 261 | 2,416 | 5 | 9 | 3 | 6 | 0 | 2 | 2,702 |
| 19 | 413 | 1,208 | 1 | 3 | 2 | 0 | 0 | 4 | 1,711 |
| 20 | 941 | 2,251 | 26 | 19 | 6 | 3 | 0 | 52 | 3,298 |
| 21 | 660 | 844 | 25 | 8 | 1 | 2 | 0 | 5 | 1,553 |
| 22 | 360 | 617 | 2 | 4 | 1 | 0 | 0 | 82 | 1,066 |
| 23 | 64 | 142 | 8 | 1 | 1 | 0 | 0 | 119 | 335 |
| Total | 6,543 | 27,149 | 139 | 104 | 174 | 70 | 1 | 385 | 34,565 |
| Percentage | 18.93 | 78.54 | 0.40 | 0.30 | 0.50 | 0.20 | 0.00 | 1.11 | 100 |
Households By Outer Wall Details
Households By Outer Wall Details
Tap bars or slices to view details
F) Details of Households Based on Floor
In this sub-metropolitan city, 6 types of housing structures can be found based on floor ownership. 22,416 households, or 64.85 percent, are using cement concrete floors. Similarly, the number of households using mud floors is 8,706, or 25.19 percent, 666 households or 1.93 percent use bricks/stones, 1,787 households or 5.17 percent use ceramic tiles, 841 households or 2.43 percent use wooden planks/bamboo, and 149 households or 0.43 percent have an unspecified status. Due to Nepal's high seismic sensitivity, it is essential to construct earthquake-resistant houses. If the government can ensure housing security for ultra-poor families by building integrated settlements, it will affirm the state's welfare role. The detailed description is presented in the table below.
| Ward No. | Mud | Wooden Planks/Bamboo | Bricks/Stones | Ceramic Tile | Cement Concrete | Other | Total |
|---|---|---|---|---|---|---|---|
| 1 | 127 | 48 | 67 | 172 | 1,745 | 8 | 2,167 |
| 2 | 78 | 14 | 26 | 85 | 1,158 | 2 | 1,363 |
| 3 | 48 | 28 | 12 | 9 | 454 | 5 | 556 |
| 4 | 158 | 112 | 25 | 209 | 2,392 | 22 | 2,918 |
| 5 | 122 | 29 | 51 | 33 | 899 | 3 | 1,137 |
| 6 | 216 | 13 | 194 | 71 | 914 | 3 | 1,411 |
| 7 | 44 | 17 | 6 | 40 | 571 | 4 | 682 |
| 8 | 69 | 17 | 6 | 31 | 729 | 0 | 852 |
| 9 | 157 | 24 | 19 | 41 | 1,172 | 12 | 1,425 |
| 10 | 126 | 52 | 20 | 359 | 2,095 | 11 | 2,663 |
| 11 | 96 | 40 | 18 | 66 | 778 | 3 | 1,001 |
| 12 | 140 | 35 | 20 | 172 | 1,370 | 1 | 1,738 |
| 13 | 708 | 46 | 20 | 9 | 680 | 3 | 1,466 |
| 14 | 748 | 16 | 3 | 9 | 276 | 4 | 1,056 |
| 15 | 702 | 12 | 5 | 8 | 404 | 14 | 1,145 |
| 16 | 493 | 16 | 34 | 3 | 548 | 6 | 1,100 |
| 17 | 514 | 99 | 16 | 47 | 544 | 0 | 1,220 |
| 18 | 302 | 54 | 28 | 225 | 2,085 | 8 | 2,702 |
| 19 | 640 | 23 | 21 | 45 | 974 | 8 | 1,711 |
| 20 | 1,208 | 112 | 28 | 126 | 1,814 | 10 | 3,298 |
| 21 | 1,073 | 22 | 11 | 5 | 439 | 3 | 1,553 |
| 22 | 655 | 12 | 36 | 15 | 329 | 19 | 1,066 |
| 23 | 282 | 0 | 0 | 7 | 46 | 0 | 335 |
| Total | 8,706 | 841 | 666 | 1,787 | 22,416 | 149 | 34,565 |
| Percentage | 25.19 | 2.43 | 1.93 | 5.17 | 64.85 | 0.43 | 100 |
Details of Households Based on Floor
Details of Households Based on Floor
Tap bars or slices to view details
G) Details of Households Based on Roof
| Ward No. | Galvanized/Tin | Cement Concrete | Thatch/Straw | Tile/Roofing | Stone/Slate | Wood/Planks | Other | Total |
|---|---|---|---|---|---|---|---|---|
| 1 | 157 | 1,140 | 9 | 10 | 48 | 3 | 0 | 2,167 |
| 2 | 119 | 1,208 | 4 | 10 | 17 | 3 | 2 | 1,363 |
| 3 | 71 | 475 | 2 | 3 | 4 | 1 | 0 | 556 |
| 4 | 232 | 2,624 | 5 | 4 | 14 | 17 | 22 | 2,918 |
| 5 | 170 | 954 | 2 | 8 | 2 | 1 | 0 | 1,137 |
| 6 | 218 | 1,126 | 14 | 44 | 5 | 1 | 3 | 1,411 |
| 7 | 59 | 602 | 3 | 9 | 2 | 7 | 0 | 682 |
| 8 | 84 | 746 | 10 | 1 | 8 | 2 | 1 | 852 |
| 9 | 92 | 1,253 | 11 | 65 | 2 | 2 | 0 | 1,425 |
| 10 | 127 | 2,496 | 14 | 11 | 5 | 6 | 4 | 2,663 |
| 11 | 121 | 851 | 9 | 0 | 9 | 11 | 0 | 1,001 |
| 12 | 174 | 1,532 | 6 | 19 | 6 | 0 | 1 | 1,738 |
| 13 | 460 | 885 | 32 | 83 | 3 | 3 | 0 | 1,466 |
| 14 | 396 | 475 | 62 | 120 | 2 | 0 | 1 | 1,056 |
| 15 | 349 | 527 | 85 | 175 | 4 | 2 | 3 | 1,145 |
| 16 | 324 | 712 | 16 | 31 | 4 | 13 | 0 | 1,100 |
| 17 | 322 | 809 | 12 | 75 | 1 | 1 | 0 | 1,220 |
| 18 | 326 | 2,319 | 14 | 33 | 8 | 2 | 0 | 2,702 |
| 19 | 551 | 1,091 | 21 | 39 | 3 | 0 | 6 | 1,711 |
| 20 | 1,154 | 1,966 | 49 | 110 | 16 | 1 | 2 | 3,298 |
| 21 | 622 | 768 | 38 | 118 | 6 | 0 | 1 | 1,553 |
| 22 | 393 | 559 | 59 | 43 | 7 | 1 | 4 | 1,066 |
| 23 | 155 | 98 | 55 | 26 | 0 | 0 | 1 | 335 |
| Total | 6,676 | 26,016 | 532 | 1,037 | 176 | 77 | 51 | 34,565 |
| Percentage | 19.31 | 75.27 | 1.54 | 3.00 | 0.51 | 0.22 | 0.15 | 100 |
Details of Households Based on Roof
Details of Households Based on Roof
Tap bars or slices to view details
4.1.3 Import Export Status
For any sub-metropolitan city to be economically strong, it is mandatory that exports exceed imports. When the volume of exports is greater than imports, it increases trade profit and helps elevate the economic standard. Only by promoting the products produced within the sub-metropolitan city, becoming self-reliant in local products, and increasing exports can the economic status of the sub-metropolitan city grow. From the sub-metropolitan city, agricultural products such as paddy, rice, lentils, vegetables, fish and meat, as well as animal products like goats, pigs, boars, and chickens are exported to other neighboring local levels and places. On the other hand, additional food items, clothes, household electrical appliances, construction materials, educational materials, chemical fertilizers, fruits, health medicines, and equipment are imported. Since imports exceed exports, the trade deficit of the sub-metropolitan city can be clearly estimated. However, for exact statistics, the sub-metropolitan city needs to take a special initiative.
4.1.4 Industrial Raw Material Production
Although Nepal is rich in terms of the abundance of raw materials based on local resources, the reality before us is that it lags far behind in their sustainable utilization. The resources available to us include herbs, fruits, food grains, vegetables, etc. The commercial production and sustainable utilization of such raw materials will directly and positively contribute to the economy of the sub-metropolitan city. In addition, substantial benefits can also be derived from commercial animal husbandry.
4.1.5 Foreign Employment Description
From this municipality, the number of people going for foreign employment to various countries is 3,804. Analyzing by age group, the highest number, 1,642 people, from the 15-24 age group have gone for foreign employment, whereas the lowest number, 10 people, from the above 65 years age group have gone. Among those who have gone for foreign employment, the highest number is of those going to Middle Eastern countries.
| Age Group | Gender | Name of Country | Total | ||||||||||||
|---|---|---|---|---|---|---|---|---|---|---|---|---|---|---|---|
| India | SAARC | Middle East Asia | Other Asian | Europe | Other Europe | North America | South America | Africa | Pacific | Other | Unspecified | ||||
| 0-14 Years | Male | 63 | 0 | 1 | 13 | 4 | 4 | 3 | 20 | 0 | 0 | 10 | 0 | 0 | 118 |
| Female | 23 | 0 | 3 | 0 | 3 | 1 | 8 | 9 | 0 | 0 | 2 | 0 | 4 | 53 | |
| Total | 86 | 0 | 4 | 13 | 7 | 5 | 11 | 29 | 0 | 0 | 12 | 0 | 4 | 171 | |
| 15-24 Years | Male | 435 | 5 | 202 | 451 | 42 | 27 | 24 | 76 | 0 | 4 | 73 | 5 | 3 | 1,347 |
| Female | 96 | 2 | 5 | 25 | 21 | 22 | 15 | 52 | 1 | 4 | 49 | 1 | 2 | 295 | |
| Total | 531 | 7 | 207 | 476 | 63 | 49 | 39 | 128 | 1 | 8 | 122 | 6 | 5 | 1,642 | |
| 25-34 Years | Male | 157 | 4 | 126 | 533 | 51 | 53 | 11 | 67 | 0 | 12 | 56 | 3 | 5 | 1,078 |
| Female | 55 | 0 | 4 | 36 | 17 | 12 | 7 | 31 | 0 | 1 | 39 | 0 | 1 | 203 | |
| Total | 212 | 4 | 130 | 569 | 68 | 65 | 18 | 98 | 0 | 13 | 95 | 3 | 6 | 1,281 | |
| 35-44 Years | Male | 101 | 2 | 76 | 235 | 16 | 9 | 2 | 13 | 0 | 7 | 4 | 0 | 5 | 470 |
| Female | 18 | 0 | 2 | 16 | 1 | 0 | 0 | 5 | 0 | 0 | 0 | 0 | 0 | 42 | |
| Total | 119 | 2 | 78 | 251 | 17 | 9 | 2 | 18 | 0 | 7 | 4 | 0 | 5 | 512 | |
| 45-54 Years | Male | 35 | 0 | 4 | 33 | 1 | 0 | 0 | 3 | 0 | 2 | 0 | 0 | 0 | 78 |
| Female | 4 | 0 | 0 | 6 | 1 | 0 | 0 | 2 | 0 | 0 | 0 | 0 | 0 | 13 | |
| Total | 39 | 0 | 4 | 39 | 2 | 0 | 0 | 5 | 0 | 2 | 0 | 0 | 0 | 91 | |
| 55-64 Years | Male | 10 | 0 | 2 | 4 | 0 | 0 | 0 | 2 | 0 | 0 | 2 | 0 | 0 | 20 |
| Female | 2 | 0 | 0 | 0 | 0 | 1 | 0 | 1 | 0 | 0 | 0 | 0 | 0 | 4 | |
| Total | 12 | 0 | 2 | 4 | 0 | 1 | 0 | 3 | 0 | 0 | 2 | 0 | 0 | 24 | |
| Above 65 Years | Male | 3 | 0 | 0 | 1 | 2 | 0 | 0 | 0 | 0 | 0 | 0 | 0 | 0 | 6 |
| Female | 1 | 0 | 0 | 0 | 1 | 0 | 0 | 2 | 0 | 0 | 0 | 0 | 0 | 4 | |
| Total | 4 | 0 | 0 | 1 | 3 | 0 | 0 | 2 | 0 | 0 | 0 | 0 | 0 | 10 | |
| Unspecified | Male | 12 | 0 | 4 | 13 | 5 | 4 | 1 | 8 | 0 | 1 | 4 | 0 | 5 | 57 |
| Female | 5 | 0 | 2 | 1 | 0 | 1 | 1 | 2 | 0 | 0 | 4 | 0 | 0 | 16 | |
| Total | 17 | 0 | 6 | 14 | 5 | 5 | 2 | 10 | 0 | 1 | 8 | 0 | 5 | 73 | |
| Total | Male | 816 | 11 | 415 | 1,283 | 121 | 97 | 41 | 189 | 0 | 26 | 149 | 8 | 18 | 3,174 |
| Female | 204 | 2 | 16 | 84 | 44 | 37 | 31 | 104 | 1 | 5 | 94 | 1 | 7 | 630 | |
| Total | 1,020 | 13 | 431 | 1,367 | 165 | 134 | 72 | 293 | 1 | 31 | 243 | 9 | 25 | 3,804 | |
4.1.6 Sukumbasi Related Description
In Nepal, the issue of family land ownership is linked to economic status. Since Nepal's economy is based on agriculture, it is natural to link land ownership with economic status, but recently, with the increase in people's access to foreign employment and other service sectors, the trend of building one's economic status from non-agricultural sectors has started. On the other hand, land ownership is also viewed as one's birthplace or place of residence. In this sense, every citizen's land ownership has been viewed as a major economic, social, and political issue since centuries. Similarly, the distribution of land in Nepal is unscientific.
4.2 Land Use and Ownership
4.2.1 Land Use Distribution
Land is an important natural resource. It should be properly used for economic development. Land is used for management of agriculture, housing, roads, drinking water, irrigation, electricity and energy, information and communication, etc. In this section, a factual depiction of the land use and land cover of the sub-metropolitan city has been provided.
Looking at the current land use of this sub-metropolitan city, 80.14 percent, i.e., the largest area, is occupied by the agricultural sector, followed by settlements in the second position. Among the available land, the portion of cultivable land is good. There seems to be a good possibility of production if scientific agricultural systems can be adopted in all the cultivable land. Another notable aspect of land use in this city is the area covered by its agriculture. It is positive for the city dwellers that 80.14 percent of the total land area remains cultivable. Detailed descriptions of other land uses are mentioned in the table below:-
| Land Use Category | Sub-Metropolitan City Land Use Description Area (Sq. Km.) | Area in Percentage |
|---|---|---|
| Agriculture | 68.87 | 80.14 |
| Public Use Area | 2.97 | 3.45 |
| Religious Area | 0.02 | 0.03 |
| Shrub/Bushes Area | 2.25 | 2.61 |
| Water Area | 0.74 | 0.86 |
| Industrial Area | 0.89 | 1.03 |
| Public Place | 2.97 | 3.45 |
| Residential Area | 6.96 | 8.10 |
| Other Area | 0.28 | 0.33 |
| Total | 85.94 | 100 |
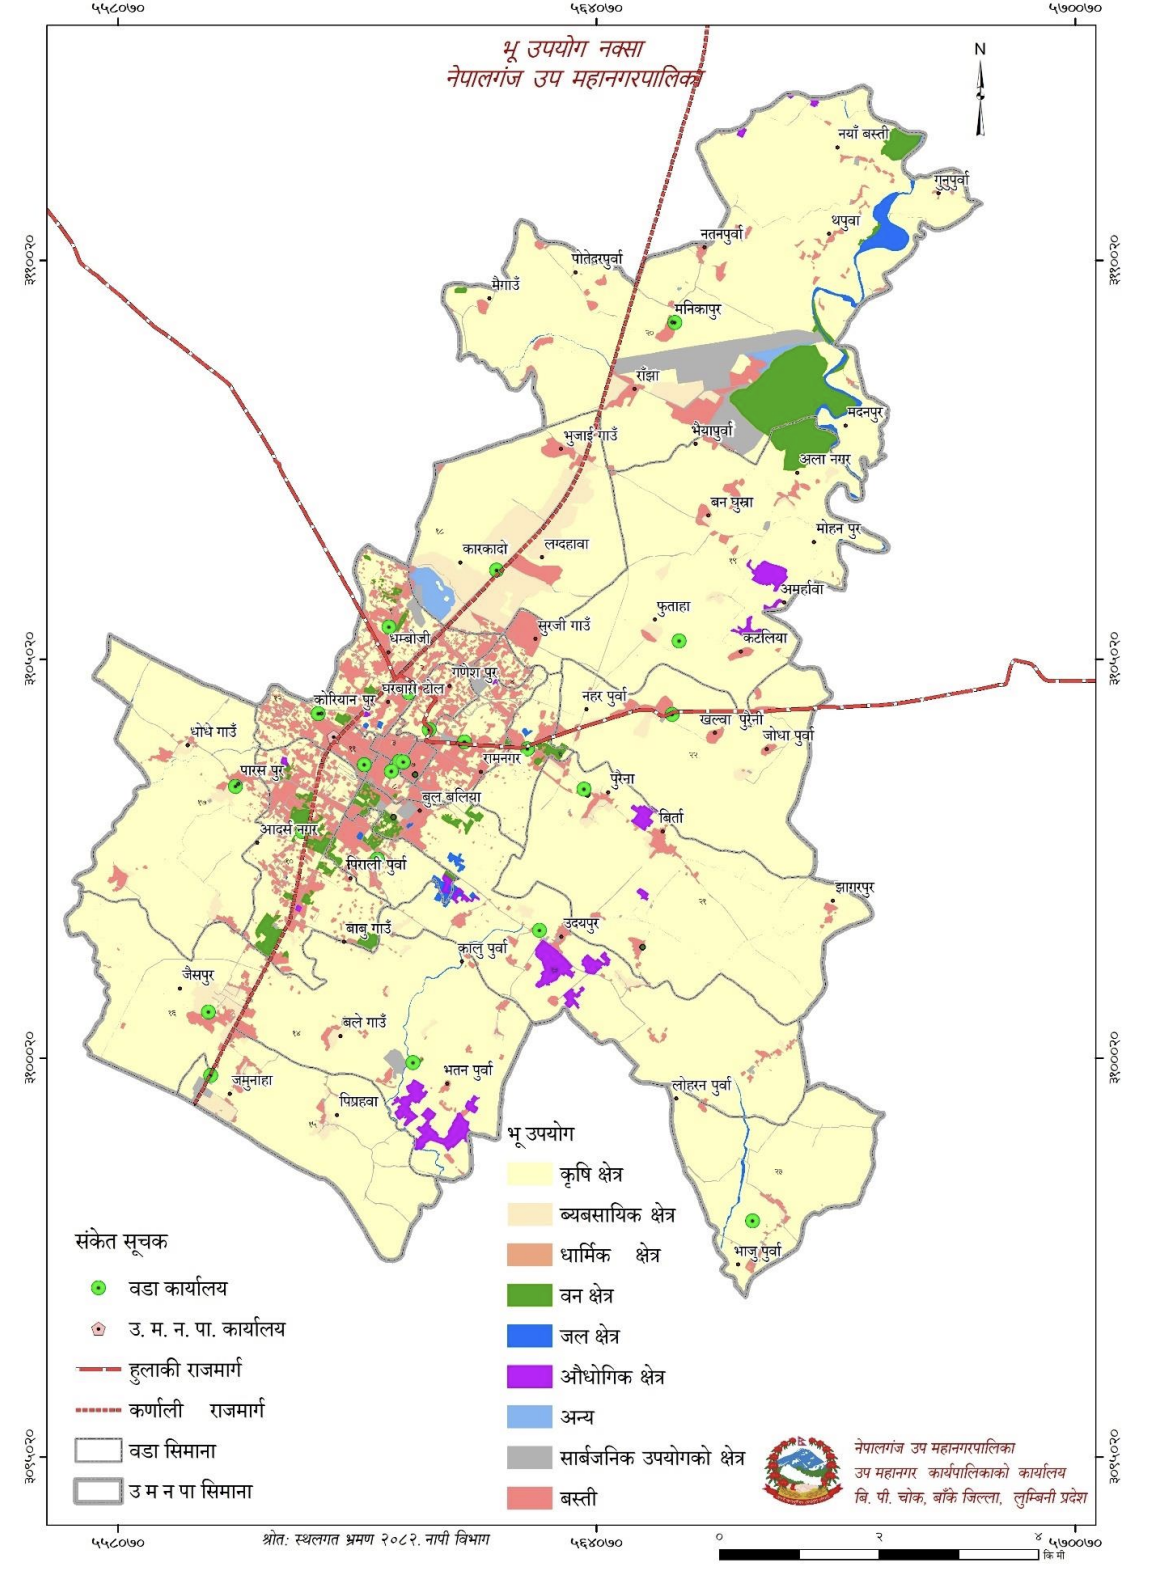
Map No. 4: Land Use Map of the Sub-Metropolitan City
4.2.2 Cultivable Land Description
Without scientific and professional land use, the agricultural sector is facing heavy losses. It is observed that not all cultivable land available in the city is being utilized scientifically and professionally. Although cultivable land is available, its lack of full utilization leads to land becoming barren on one hand, and a decrease in agricultural production leading to required imports on the other. According to data from the Land Information System, 68.87 sq. km., i.e., 80.14 percent of the land in the sub-metropolitan city, is cultivable.
Just having cultivable land is not enough; it must have irrigation facilities. To fully utilize cultivable land for farming, providing irrigation facilities is mandatory. Therefore, local levels should prepare accurate descriptions of cultivable land in their area and maintain correct data on both irrigated and non-irrigated land. Following this, it's necessary to focus priority on providing irrigation to non-irrigated land through single or alternative methods.
4.2.3 Barren Land Description
In the city, some areas contain barren land in an unused state. All types of land can be utilized in one way or another. Land itself is an invaluable natural resource. In non-farming areas, fodder or medicinal herbs can be planted, or if suitable areas are available, they can be developed into open spaces, recreation centers, parks, or gardens. In cases where farming is not possible, such land can also be utilized for housing development. In this sub-metropolitan city, non-irrigated lands are in a barren state.
4.3 Agriculture and Animal Development
History shows that agriculture has been the backbone of development for industrial nations that have achieved the highest levels of development today. The foundation of prosperity for powerful nations in Europe, America, and Asia is also based on agricultural revolutions. Therefore, given the limited alternatives to agriculture and its vast potential in our country, the first mandatory requirement before implementing other ambitious development plans is to revolutionize the agricultural sector to become self-reliant in food grains, fruits, vegetables, and overall agricultural produce, thereby increasing exports. Even in today's era of advanced technologies, remaining limited to our subsistence-oriented traditional farming system is a kind of irony. Therefore, local governments should conduct feasibility studies and revolutionize agricultural production and development through the development of all necessary agricultural infrastructures for professional and scientific farming.
4.4 Agricultural Family, Area, Parcel and Irrigated Area
In the National Census 2078, a Sample Frame was prepared for conducting the National Agriculture Census based on agricultural family details, including land and livestock information for each family. Wards or enumeration areas were selected based on that frame, and detailed information on agricultural families was collected. According to the results of the National Agriculture Census 2078, the total number of agricultural families in Nepalgunj Sub-Metropolitan City is 7,222.
The 7,222 agricultural families in this sub-metropolitan city are observed to be practicing agriculture on 4,435.5 hectares of land across 16,557 parcels. On average, an agricultural family farms on 2.3 parcels. The total irrigated area here is 3,423.5 hectares.
| Province/District/Local Level | Total Agricultural Families | Total Land Area Utilized (Hectares) | Total Number of Parcels | Average Number of Parcels | Families Using Irrigation | Irrigated Area (Hectares) |
|---|---|---|---|---|---|---|
| Lumbini Province | 75,092 | 426,614.4 | 2,252,764 | 2.9 | 548,799 | 241,944.3 |
| Banke District | 63,885 | 36,828.3 | 149,775 | 2.2 | 56,981 | 25,115.3 |
| Nepalgunj Sub-Metropolitan City | 7,222 | 4,435.5 | 16,557 | 2.3 | 6,849 | 3,423.5 |
4.5 Land Consumption Description
According to the results of the National Agriculture Census 2078, regarding land consumption in this sub-metropolitan city, the number of agricultural families farming only on family-owned land is 5,864 (81.20%), covering an area of 3,288.1 hectares (74.13%). Similarly, the number of agricultural families farming only on land owned by others under certain agreements is 146 (2.02%), covering 127.3 hectares (2.87%). There are no farmers practicing agriculture under other types of consumption in this sub-metropolitan city. Furthermore, the number of agricultural families farming on land with more than one type of ownership is 1,212 (16.78%), covering an area of 1,020 hectares (23%).
| Province/District/Local Level | Total Agricultural Families | Total Land Area Utilized (Hectares) | Single Type of Ownership | More than One Type of Ownership | ||||||
|---|---|---|---|---|---|---|---|---|---|---|
| Farming Only on Family Owned Land | Farming Only on Land Owned by Others | Farming Under Other Types of Consumption | ||||||||
| Number of Families | Area (Hectares) | Number of Families | Area (Hectares) | Number of Families | Area (Hectares) | Number of Families | Area (Hectares) | |||
| Lumbini Province | 75,092 | 426,614.4 | 633,504 | 330,352.5 | 6,722 | 3,299.5 | 2,573 | 663.5 | 122,293 | 92,299.0 |
| Banke District | 63,885 | 36,828.3 | 54,206 | 27,257.1 | 1,549 | 656.3 | 516 | 97.8 | 11,615 | 8,817.1 |
| Nepalgunj Sub-Metropolitan City | 7,222 | 4,435.5 | 5,864 | 3,288.1 | 146 | 127.3 | 0 | 0 | 1,212 | 1,020.0 |
| Province/District/Local Level | Food Crops | Pulse/Lentil Crops | Tuber Crops | Oilseed Crops | Vegetable Crops | Other Temporary Crops | ||||||
|---|---|---|---|---|---|---|---|---|---|---|---|---|
| No. of Families | Area | No. of Families | Area | No. of Families | Area | No. of Families | Area | No. of Families | Area | No. of Families | Area | |
| Lumbini Province | 729,496 | 511,178.0 | 388,616 | 44,965.4 | 400,375 | 15,057.6 | 382,429 | 57,798.5 | 363,129 | 16,587.8 | 352,086 | 17,639.0 |
| Banke District | 63,246 | 50,535.7 | 31,645 | 7,247.9 | 24,406 | 1,021.0 | 20,761 | 3,914.3 | 21,962 | 1,539.2 | 25,268 | 815.4 |
| Nepalgunj Sub-Metropolitan City | 6,636 | 7,279.3 | 2,359 | 353.5 | 847 | 35.6 | 827 | 170.3 | 2,186 | 246.6 | 1,711 | 73.3 |
| Province/District/Local Level | Paddy Crop | Wheat Crop | Maize Crop | Millet Crop | Barley Crop | Buckwheat Crop | ||||||
|---|---|---|---|---|---|---|---|---|---|---|---|---|
| No. of Families | Area | No. of Families | Area | No. of Families | Area | No. of Families | Area | No. of Families | Area | No. of Families | Area | |
| Lumbini Province | 0.25 | 248,818.8 | 495,137 | 168,826.1 | 452,282 | 77,719.0 | 64,500 | 7,305.6 | 81,533 | 7,567.2 | 8,577 | 616.1 |
| Banke District | 59,395 | 28,898.4 | 46,626 | 18,355.9 | 25,840 | 3,201.9 | 54 | 8.1 | 82 | 7.1 | 133 | 57.2 |
| Nepalgunj Sub-Metropolitan City | 6,375 | 3,189.3 | 5,885 | 3,129.7 | 1,164 | 160.2 | 0 | 0 | 0 | |||
| Province/District/Local Level | Total Agricultural Families | Total Area Utilized (Ha.) | Permanent Crops | |||||||||
|---|---|---|---|---|---|---|---|---|---|---|---|---|
| Number of Agricultural Families | Total Area of Permanent Crops (Ha.) | Planted as Orchards | Scattered Trees | |||||||||
| Productive Age | Non-productive Age | Productive Age | Non-productive Age | |||||||||
| No. of Families | Area (Ha.) | No. of Trees | No. of Families | Area (Ha.) | No. of Trees | |||||||
| Lumbini Province | 75,092 | 426,614.4 | 463,750 | 29,379.5 | 102,704 | 6,265.5 | 5,098,107 | 130,664 | 23,114.1 | 2,709,953 | 5,608,128 | 2,021,997 |
| Banke District | 63,885 | 36,828.3 | 30,321 | 398.2 | 3405 | 333.0 | 65,979 | 1,130 | 65.2 | 53,893 | 140,560 | 76,661 |
| Nepalgunj Sub-Metropolitan City | 7,222 | 4,435.5 | 1,665 | 97.0 | 615 | 91.0 | 10,314 | 63 | 6.0 | 37,907 | 2,990 | 2,421 |
| Province/ District/ Local Level | Orange | Lime | Mango | Banana | ||||||||||||
|---|---|---|---|---|---|---|---|---|---|---|---|---|---|---|---|---|
| No. of Families | Planted as Orchards | No. of Scattered Trees | No. of Families | Planted as Orchards | No. of Scattered Trees | No. of Families | Planted as Orchards | No. of Scattered Trees | No. of Families | Planted as Orchards | No. of Scattered Trees | |||||
| Area | No. of Trees | Area | No. of Trees | Area | No. of Trees | Area | No. of Trees | |||||||||
| Lumbini Province | 68,491 | 865.4 | 616,503 | 350,468 | 126,694 | 597.2 | 461,633 | 385,126 | 68,491 | 865.4 | 616,503 | 350,468 | 126,694 | 597.2 | 461,633 | 385,126 |
| Banke District | 47 | 0.0 | 0 | 47 | 7,546 | 25.2 | 6,544 | 16,583 | 24,020 | 294.8 | 48,006 | 77,368 | 5,559 | 12.5 | 6,806 | 23,744 |
| Nepalgunj Sub-Metropolitan City | 0.0 | 0 | 0 | 100 | 0.1 | 25 | 163 | 1,265 | 74.9 | 5,980 | 3,141 | 138 | 5.6 | 552 | 188 | |
| Province/ District/ Local Level | Total Number of Agricultural Families | Paddy | |||||||
|---|---|---|---|---|---|---|---|---|---|
| No. of Families | Type of Seeds | Families Using Pesticides | Use of Fertilizers | ||||||
| No. of Families Using Inputs | No. of Families | ||||||||
| Local | Improved | Hybrid | Local/ Organic | Mineral/ Chemical | Both | ||||
| Lumbini Province | 75,092 | 520,581 | 154,309 | 175,261 | 191,011 | 219,450 | 70,016 | 190,750 | 259,815 |
| Banke District | 63,885 | 59,395 | 18,588 | 12,516 | 28,291 | 27,496 | 6,886 | 14,528 | 37,981 |
| Nepalgunj Sub-Metropolitan City | 7,222 | 6,375 | 1,532 | 1,353 | 3,489 | 3,583 | 808 | 2,178 | 3,390 |
| Province/District/Local Level | Total Number of Agricultural Families | Maize | |||||||
|---|---|---|---|---|---|---|---|---|---|
| No. of Families | Type of Seeds | Families Using Pesticides | Use of Fertilizers | ||||||
| No. of Families Using Inputs | No. of Families | ||||||||
| Local | Improved | Hybrid | Local/ Organic | Mineral/ Chemical | Both | ||||
| Lumbini Province | 75,092 | 452,282 | 311,770 | 81,455 | 59,058 | 66,474 | 282,034 | 41,401 | 128,847 |
| Banke District | 63,885 | 63,885 | 25,840 | 13,089 | 5,752 | 6,999 | 5,903 | 12,933 | 4,022 |
| Nepalgunj Sub-Metropolitan City | 7,222 | 7,222 | 1,164 | 428 | 369 | 367 | 252 | 497 | 241 |
| Province/District/Local Level | Total Number of Agricultural Families | Wheat | |||||||
|---|---|---|---|---|---|---|---|---|---|
| No. of Families | Type of Seeds | Families Using Pesticides | Use of Fertilizers | ||||||
| No. of Families Using Inputs | No. of Families | ||||||||
| Local | Improved | Hybrid | Local/ Organic | Mineral/ Chemical | Both | ||||
| Lumbini Province | 75,092 | 495,137 | 266,944 | 228,192 | 132,833 | 176,623 | 164,064 | 154,450 | 495,137 |
| Banke District | 63,885 | 46,626 | 21,307 | 25,320 | 15,689 | 8,746 | 12,091 | 25,789 | 46,626 |
| Nepalgunj Sub-Metropolitan City | 7,222 | 5,885 | 2,017 | 3,868 | 1,789 | 1,244 | 1,947 | 2,693 | 5,885 |
| Province/ District/ Local Level | Total Agricultural Families | Domestic Animals | Domestic Birds | |||||||||||||||
|---|---|---|---|---|---|---|---|---|---|---|---|---|---|---|---|---|---|---|
| Total Families Raising Livestock | Cow/Ox | Buffalo | Goat/Chyangra | Sheep | Pig/Boar | Other Animals | Chicken | Other Birds | ||||||||||
| No. of Families | No. of Cow/Ox | No. of Families | No. of Buffalo | No. of Families | No. of Goat/Chyangra | No. of Families | No. of Sheep | No. of Families | No. of Pig/Boar | No. of Families | No. of Other Animals | No. of Families | No. of Chicken | No. of Families | No. of Other Birds | |||
| Lumbini Province | ||||||||||||||||||
| Banke District | ||||||||||||||||||
| Nepalgunj Sub-Metropolitan City | ||||||||||||||||||
| Province/District/ Local Level | Total Agricultural Families | Permanent Workers | Temporary Workers | Labor Exchange (Parma) Workers | Contract Workers | ||||||||||||
|---|---|---|---|---|---|---|---|---|---|---|---|---|---|---|---|---|---|
| Families Using Workers | Number of Permanent Workers | Families Using Workers | Temporary Worker Person-days | Families Using Workers | Labor Exchange Worker Person-days | Families Using Workers | Contract Worker Person-days | ||||||||||
| Total | Male | Female | Total | Male | Female | Total | Male | Female | Total | Male | Female | ||||||
| Lumbini Province | 75,092 | 5,163 | 10,942 | 5,923 | 5,019 | 290,350 | 7,231,030 | 2,464,998 | 4,766,032 | 290,560 | 4,532,270 | 1,427,936 | 3,104,334 | 8,525 | 140,745 | 62,315 | 78,431 |
| Banke District | 63,885 | 962 | 2,083 | 989 | 1,094 | 20,166 | 426,777 | 140,195 | 286,582 | 18,126 | 275,566 | 53,755 | 151,811 | 1,430 | 18,088 | 6,895 | 11,193 |
| Nepalgunj Sub-Metropolitan City | 7,222 | 50 | 100 | 87 | 13 | 2,475 | 36,933 | 12,373 | 24,561 | 2,157 | 20,347 | 9,586 | 10,761 | 113 | 588 | 313 | 275 |
| Province/ District/ Local Level | Total Agricultural Families | Families Taking Agricultural Loans | Families Stating Need for Additional Loans | Families Insured for Agricultural Activities | Families Receiving Government Grants |
|---|---|---|---|---|---|
| Lumbini Province | 75,092 | 71,651 | 193,373 | 30,160 | 54,205 |
| Banke District | 63,885 | 9,268 | 11,951 | 2,548 | 1,778 |
| Nepalgunj Sub-Metropolitan City | 7,222 | 1,090 | 2,767 | 326 | 201 |
| Province/District/Local Level | Total Number of Agricultural Families | Number of Agricultural Families Aware of Climate Change | Agricultural Families Stating Climate Change Impact on Agriculture | Agricultural Families According to Climate Change Impact on Agricultural Activities | |||||||||
|---|---|---|---|---|---|---|---|---|---|---|---|---|---|
| Decrease in Production | Increase in Production | Change in Size of Fruit/Crop | Change in Taste | Difference in Planting Time | More or Less Rainfall | Increase in Pest/Disease Outbreak | Change in Breeding Time | Loss/Emergence of Species | Other | ||||
| Lumbini Province | 75092 | 346768 | 314193 | 266768 | 32019 | 74468 | 54821 | 136711 | 180477 | 184875 | 13963 | 16175 | 576 |
| Banke District | 63885 | 29165 | 25915 | 21142 | 4804 | 7377 | 8286 | 9474 | 13537 | 14433 | 1512 | 2202 | 37 |
| Nepalgunj Sub-Metropolitan City | 7222 | 2408 | 2366 | 1739 | 338 | 251 | 339 | 626 | 464 | 1502 | 13 | 0 | 0 |
| Province/District/Local Level | Total Number of Agricultural Families | Number of Agricultural Families Managing Waste from Agricultural Practices | ||||||
|---|---|---|---|---|---|---|---|---|
| By Burying | By Burning | By Sending to Waste Managers | By Making Compost | Using as Fuel | By Other Methods | No Management Done | ||
| Lumbini Province | 75092 | 213317 | 368676 | 38617 | 382202 | 126581 | 196818 | 63116 |
| Banke District | 63885 | 16603 | 30357 | 5411 | 33972 | 5258 | 14894 | 3782 |
| Nepalgunj Sub-Metropolitan City | 7222 | 918 | 2023 | 1405 | 2119 | 162 | 2649 | 585 |
| Province/District/Local Level | Total Number of Agricultural Families | Number of Main Farmers by Gender | Agricultural Family Population | ||
|---|---|---|---|---|---|
| Male | Female | Male | Female | ||
| Lumbini Province | 75092 | 493454 | 271638 | 1786863 | 1919119 |
| Banke District | 63885 | 47447 | 20439 | 176262 | 177055 |
| Nepalgunj Sub-Metropolitan City | 7222 | 6093 | 1129 | 23774 | 21301 |
| Province/District/Local Level | Pop. of Families Participating in Formal Training | Pop. of Families Participating in Agr. Decisions | Pop. of Families According to Average Time Spent on Agr. Activities | |||||||||||
|---|---|---|---|---|---|---|---|---|---|---|---|---|---|---|
| Male | Female | Male | Female | Less (40%) | Approx. Half (40%-59%) | Most (60%-99%) | All (100%) | No Time Given | ||||||
| Male | Female | Male | Female | Male | Female | Male | Female | Male | Female | |||||
| Lumbini Province | 92890 | 87354 | 914553 | 965870 | 323413 | 302797 | 291516 | 320610 | 374507 | 430487 | 245286 | 326891 | 234527 | 241189 |
| Banke District | 9914 | 8891 | 83426 | 76239 | 33988 | 30959 | 28224 | 29301 | 32982 | 32217 | 25601 | 32298 | 23881 | 22990 |
| Nepalgunj Sub-Metropolitan City | 1067 | 779 | 9136 | 5463 | 2538 | 1794 | 4368 | 3941 | 4458 | 3486 | 3288 | 3061 | 5016 | 5009 |
| Province/District/Local Level | Total Number of Agricultural Families | Household Head | Agr. Practice Status | |||
|---|---|---|---|---|---|---|
| Main Farmer is Household Head | Other Person is Household Head | Single-Practice Family | Multi-Practice Family | Shared-Practice Family | ||
| Lumbini Province | 75092 | 695375 | 69717 | 746900 | 15470 | 2722 |
| Banke District | 63885 | 62281 | 5604 | 63648 | 4081 | 157 |
| Nepalgunj Sub-Metropolitan City | 7222 | 6984 | 239 | 7059 | 164 | 0 |
| Province/District/ Local Level | Total Number of Agricultural Families | Major Production Activities/Activities of Agricultural Practice | ||||||
|---|---|---|---|---|---|---|---|---|
| Food Crops | Vegetables | Fruits | Cash Crops | Livestock Farming | Poultry Farming | Other | ||
| Lumbini Province | 75092 | 707366 | 31756 | 1887 | 1521 | 17226 | 3248 | 2088 |
| Banke District | 63885 | 59873 | 5956 | 56 | 0 | 1621 | 284 | 96 |
| Nepalgunj Sub-Metropolitan City | 7222 | 6463 | 529 | 12 | 0 | 193 | 13 | 12 |
| Province/District/Local Level | Total Number of Agricultural Families | Major Use of Agricultural Production | |||
|---|---|---|---|---|---|
| All Household Use | Mainly HH Use and Some Sale | Mainly Sale and Some HH Use | All Sale | ||
| Lumbini Province | 75092 | 533075 | 204059 | 25221 | 2737 |
| Banke District | 63885 | 50429 | 15601 | 1622 | 233 |
| Nepalgunj Sub-Metropolitan City | 7222 | 5010 | 1548 | 626 | 38 |
| Province/ District/ Local Level | Total Number of Agricultural Families | Major Source of Income of Agr. Family | Families whose Income from Own Production is Insufficient for the Year | Number of Families According to Duration of Food Insufficiency | ||||
|---|---|---|---|---|---|---|---|---|
| Agriculture | Non-Agriculture | 1 to 3 Months | 4 to 6 Months | 7 to 9 Months | 10 to 12 Months | |||
| Lumbini Province | 75092 | 507488 | 257604 | 390474 | 97342 | 175354 | 85524 | 32253 |
| Banke District | 63885 | 46448 | 21438 | 29801 | 8128 | 10661 | 6475 | 4537 |
| Nepalgunj Sub-Metropolitan City | 7222 | 5461 | 1761 | 4145 | 1303 | 1630 | 917 | 296 |
4.6 Agricultural Land Use Details
When analyzing what crops are planted in what area by agricultural practice, according to the National Agriculture Census results, out of 7,222 total agricultural families in this sub-metropolitan city, 7,054 families are engaged in agricultural practices on cultivable land, with a total area of 4,044.0 hectares, which is 91.17%.
Out of the total area, 4,023.8 hectares (90.72%) are under temporary crops by all 7,054 families. Likewise, 100 agricultural families have 20.2 hectares (0.46%) under other cultivable land. Furthermore, 640 agricultural families use 57.9 hectares (2.19%) for permanent crops. Similarly, the area of permanent pastures, private open spaces, ponds, and other land is 294.4 hectares (6.64%).
| Province/District/Local Level | Total Number of Agricultural Families | Total Area of Land Used by Agricultural Families | Total Cultivable Land | Land Under Temporary Crops | Other Cultivable Land | Land Under Permanent Crops | Other Land | |||||
|---|---|---|---|---|---|---|---|---|---|---|---|---|
| No. of Families | Area (Hectare) | No. of Families | Area (Hectare) | No. of Families | Area (Hectare) | No. of Families | Area (Hectare) | No. of Families | Area (Hectare) | |||
| Lumbini Province | ||||||||||||
| Banke District | ||||||||||||
| Nepalgunj Sub-Metropolitan City | ||||||||||||
4.6.1 Diseases and Pests Affecting Food Crops
In order to obtain the expected production from agricultural crops, proper care and maintenance of crops is necessary. Especially since crops are attacked by diseases and pests, it is essential to take high vigilance in a timely manner to avoid diseases and pests and to gain knowledge about prevention. On the other hand, it is also necessary to correctly identify the diseases and pests that can attack crops. If the diseases and pests can be correctly identified, their prevention can be done in time and production can be secured and increased.
| S.N. | Crop | Major Pests | Major Diseases |
|---|---|---|---|
| 1 | Paddy | BPH, Grasshopper, Stem Borer, Hispa | Blast, Blight, Khaira Disease |
| 2 | Wheat | Aphids, Termites, Lahi | Loose Smut, Yellow Rust, Brown Rust, Blight, Smelling Loose Smut, etc. |
| 3 | Maize | American Fall Armyworm, White Grub, Stem Borer, Cutworm, etc. | Grey Leaf Spot, Northern Leaf Blight, Southern Leaf Blight, Stalk Rot, etc. |
| 4 | Mustard | Sawfly, Lahi | Sawfly, Lahi, etc. |
| 5 | Potato | Cutworm, Potato Tuber Moth, Red Ant, Lahi, etc. | Cutworm, Potato Tuber Moth, Red Ant, Lahi, etc. |
4.6.2 Diseases and Pests in Vegetables and Fruits
| S.N. | Crop | Major Diseases | Major Pests |
|---|---|---|---|
| 1 | Tomato | Tuta absoluta, Whitefly, Aphids, Fruit borer, Shield bug, etc. | Early Blight, Late Blight, Mosaic, etc. |
| 2 | Cauliflower, Cabbage | Diamondback Moth, Tobacco Caterpillar, Aphids, Flea Hopper, etc. | Soft Rot, Black Rot, Alternaria, Club Root, Damping Off, etc. |
| 3 | Potato | Late Blight, Mosaic, Brown Pith, Cutworm, Aphids, Leaf Spot, etc. | Potato Tuber Moth, Red Ant, Leaf Eating Caterpillar, etc. |
| 4 | Mustard Greens (Rayo) | Diamondback Moth, Tobacco Caterpillar, Aphids, Flea Hopper, etc. | Soft Rot, Black Rot, Alternaria, Club Root, Damping Off, etc. |
| 5 | Citrus (Lemon) | Shield bug, Aphids, Fruit fly, Scale insects, Root rot, Foot rot, Mildew, Leaf miner, Pink disease, Anthracnose, Citrus scab, Gummosis, Sooty mould, Canker, Citrus greening, (Citrus tristeza virus CTV), Lemon dog, etc. | Canker, Foot rot, Green bug, Fruit fly, Sooty mould, Citrus psylla, Leaf miner, Red spider mite, Blue beetle, Stem & Trunk borer, Aphids, Thrips, Nematodes, Lemon butterfly, etc. |
4.6.3 Diseases and Pests in Livestock and Poultry
Livestock and poultry farming, as a major source of income for farmers, is one of the main professions of this sub-metropolitan city. Animal diseases seen in the sub-metropolitan city include Rabies, Foot and Mouth Disease (FMD), PPR, Swine Fever, Hemorrhagic Septicemia, Black Quarter, Liver Fluke, Mate, Mastitis, reproductive issues, and worms. Anti-rabies vaccination seems necessary in wards connected to forests, while outbreaks of highly contagious diseases like FMD, PPR, and Swine Fever are occasionally seen. Causes for this include illegal movement of animals, poor management, and lack of awareness about vaccination. Continuous efforts are being made by the sub-metropolitan city for the control of these diseases.
Among bacterial diseases, farmers in this sub-metropolitan city vaccinate against Hemorrhagic Septicemia and Black Quarter. However, these diseases are seen sporadically. If vaccination against Swine Fever, FMD, and Rabies can be operated in various wards, it seems control will be successful to a large extent. Generally, large epidemics are not found in livestock/poultry. However, FMD, Hemorrhagic Septicemia, Black Quarter, Liver Fluke, and Rabies remain common in livestock, while Newcastle disease (Ranikhet), Gumboro, CRD, and Bird Flu are primarily found in birds.
4.6.4 Details of Commercial Agriculture and Animal Husbandry Farms
Most areas of Nepal still practice subsistence-oriented, traditional, and unorganized farming. To make agriculture a respected, profitable, and scientific profession, it needs to be developed in an organized and institutional manner. Currently, commercial agriculture farms have been registered in various parts of the country and the practice of organized and institutional farming has begun. By registering farms scientifically and operating agricultural businesses, it becomes easier to receive government subsidies and technical support. This also helps to make the agricultural business organized and professional. The details of agriculture and animal husbandry farms within this Sub-Metropolitan City are included in Annex 6.
4.6.5 Details of Agriculture and Animal Husbandry Related Groups and Community Organizations
Various agriculture groups are currently operating to commercialize and modernize traditional farming. These groups facilitate agricultural business while providing energy to entrepreneurs by offering certain services and facilities. Details of farmer groups help understand the involvement of farmers in the agricultural sector and the status of agricultural activities in the sub-metropolitan city, while also helping to identify what programs need to be brought in the coming days. The details of farmer groups are included in the table below.
| S.N. | Group Name | Ward No. | Contact Person |
|---|---|---|---|
| 1 | Makbul Ahmad Kuraisi | 14 | Jaispur Smart Agriculture Village Implementation Committee |
| 2 | Pashu Bikas Krishak Samuh | 19 | Balram Pun Magar |
| 3 | Yaduwanshi Pashu Palan Krishak Samuh | 20 | Ram Kumar Yadav |
| 4 | Gopalwanshi Pashupalan Farm | 20 | Binod Kumar Yadav |
| 5 | Jamuna Machha Tatha Bakhapalan Krishak Samuh | 21 | Rijwan Khan |
| 6 | Shri Ujjawal Machha Tatha Pashupalan Krishak Samuh | 21 | Dhakendra Sunar |
| 7 | Kalika Bakhapalan Krishak Samuh | 20 | Dal Bahadur Rawat |
| 8 | Shri Lumbini Krishi Pashupankhshi Tatha Machha Palan Krishak Samuh | 14 | Aftab Ansari |
| 9 | Shivshakti Mahila Krishak Samuh | 19 | Nandakala Khadka |
| 10 | Shri Jai Bageshwari Krishak Samuh | 20 | Ramkumar Yadav |
| 11 | Shri Malati Krishak Samuh | 01 | Hemraj Pokharel |
| 12 | Bali Bikas Krishak Samuh | 16 | Jambar Kapadiya |
| 13 | Shri Islam Krishak Samuh | 21 | Atiullah Bagwan |
| 14 | Radhakrishna Krishak Samuh | 22 | Gopi Pr. Yadav |
| 15 | Jai Bageshwari Krishak Samuh | 15 | Prahlad Barma |
| 16 | Mausami Krishak Samuh | 22 | Ibrahim Khan |
| 17 | Bhrikuti Organic Shahri Krishak Samuh | 10 | Narayan Sigdel |
| 18 | Milijuli Organic Shahri Krishak Samuh | 18 | Renu Gharti |
| 19 | Shanti Organic Shahri Krishak Samuh | 01 | Amuta Giri |
| 20 | Belasapur Karmohana Smart Samiti | 13 | Pramatma Barma |
| 21 | Krishna Pranggarik Nal Utpadan Krishak Samuh | 20 | Dhaneshwar Gautam |
| 22 | Samaweshi Tol Bikas Krishak Samuh | 06 | Ganesh Kumar G.C. |
4.6.6 Collection Center and Chilling Center
In an environment where large-scale agricultural production and collection center arrangements are lacking, developing collection centers at various convenient locations for small-quantity produce can help in marketing. Developing collection centers at various places helps traders purchase produce from specific locations in specific quantities, thereby supporting the development of the market system.
Just as increasing agricultural production is necessary, safe storage of produced goods is equally important. Proper storage helps maintain the nutritional value of agricultural produce. Without scientific storage, the quality of produce deteriorates on one hand and it may also be destroyed. Therefore, storing agricultural produce scientifically and making it available in the market even off-season helps maintain market price stability. For this, it is necessary to establish chilling centers, storage centers, and dairies at various locations based on need. Currently, traders in this Sub-Metropolitan City conduct food trade by privately managing ordinary and traditional storage.
4.7 Tourism Development
Nepal is known worldwide as an attractive tourist destination due to its climate, way of life, forests, flora and fauna, and cultural diversity created by its unique geographical structure. Tourism is a gift of nature to us. It is certain that the full utilization of all these tourism assets will make a significant contribution to the country's economic prosperity and strengthen the national economy. Therefore, Tourism Policy 2065 aims to create self-employment through tourism, alleviate poverty, research tangible and intangible heritage, further develop and expand air and land routes, and advance tourism infrastructure in line with the concept of sustainable development. This Sub-Metropolitan City also has abundant potential for tourism development.
Within the Sub-Metropolitan City, there are more than 30 sites of religious, historical and archaeological importance including the famous Bageshwari Temple, the statue of Mahadev with a beard, Rani Talau, Mahendra Park, Jamjam Mosque, Jama Mosque, Phulbari Mosque, Bhawani Bagh Talau, and Ramlila Maidan. There is equally great potential for homestay and cultural tourism. Cultural tourism can be promoted by incorporating various cultural programs reflecting the culture of the Magar and Tharu communities. Additionally, since the Sub-Metropolitan City is a leading producer of agricultural products, fruits, grain crops, and turmeric, developing those areas as model agricultural zones could attract agro-tourists. Therefore, it is currently necessary to expand hotels, homestays, and other necessary services and facilities for tourists.
4.7.1 Religious and Tourist Places Details
Nepalgunj Sub-Metropolitan City is characterized by multi-ethnic, multi-lingual, multi-religious and social diversity, and contains traditional temples, mosques and historical sites. The details of various tourist and religious sites in this sub-metropolitan city are mentioned in the table below.
| S.N. | Name | Importance |
|---|---|---|
| 1 | Bageshwori Temple | Religious and Tourist |
| 2 | Rani Talau | Religious and Tourist Area |
| 3 | Statue of Mahadev with Moustache | Cultural and Religious |
| 4 | Mahendra Park | Tourist Area |
| 5 | Jamjam Masjid | Cultural and Religious |
| 6 | Phulbari Masjid | Cultural and Religious |
| 7 | Bhawani Bagh Talau | Tourist Area |
| 8 | Ramlila Maidan | Tourist Area |
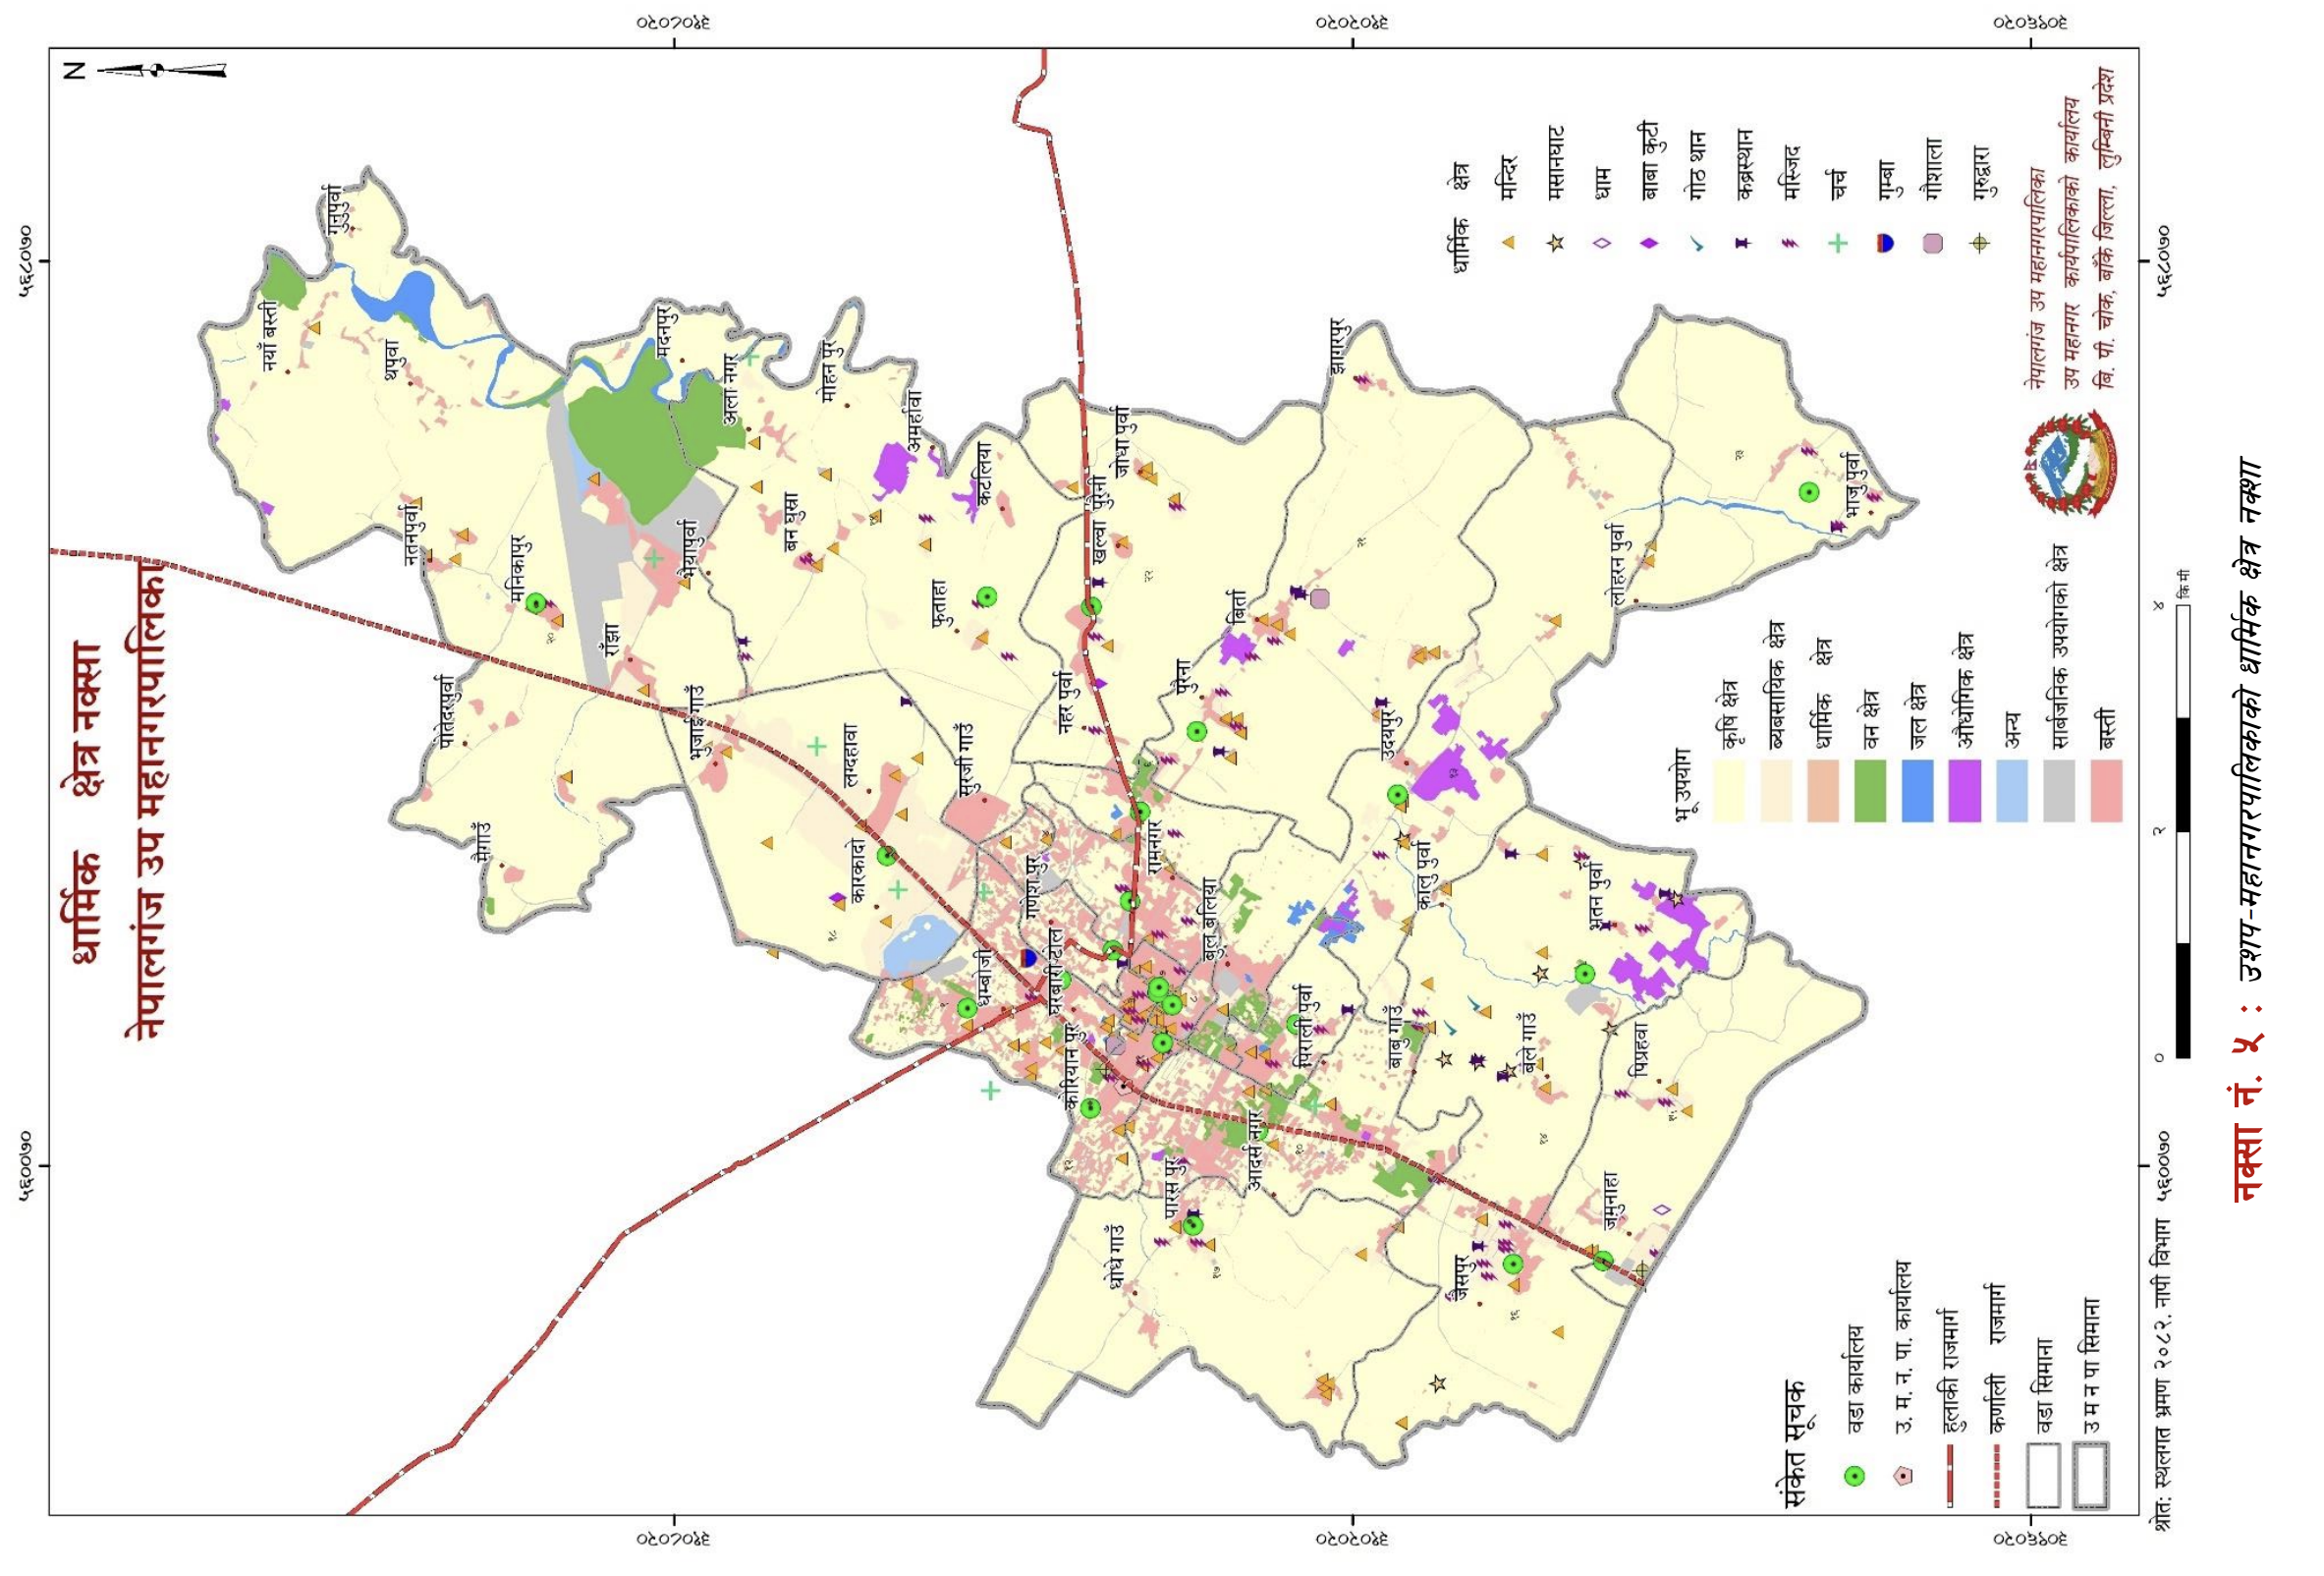
Map No. 5: Religious Places Map of Nepalgunj Sub-Metropolitan City
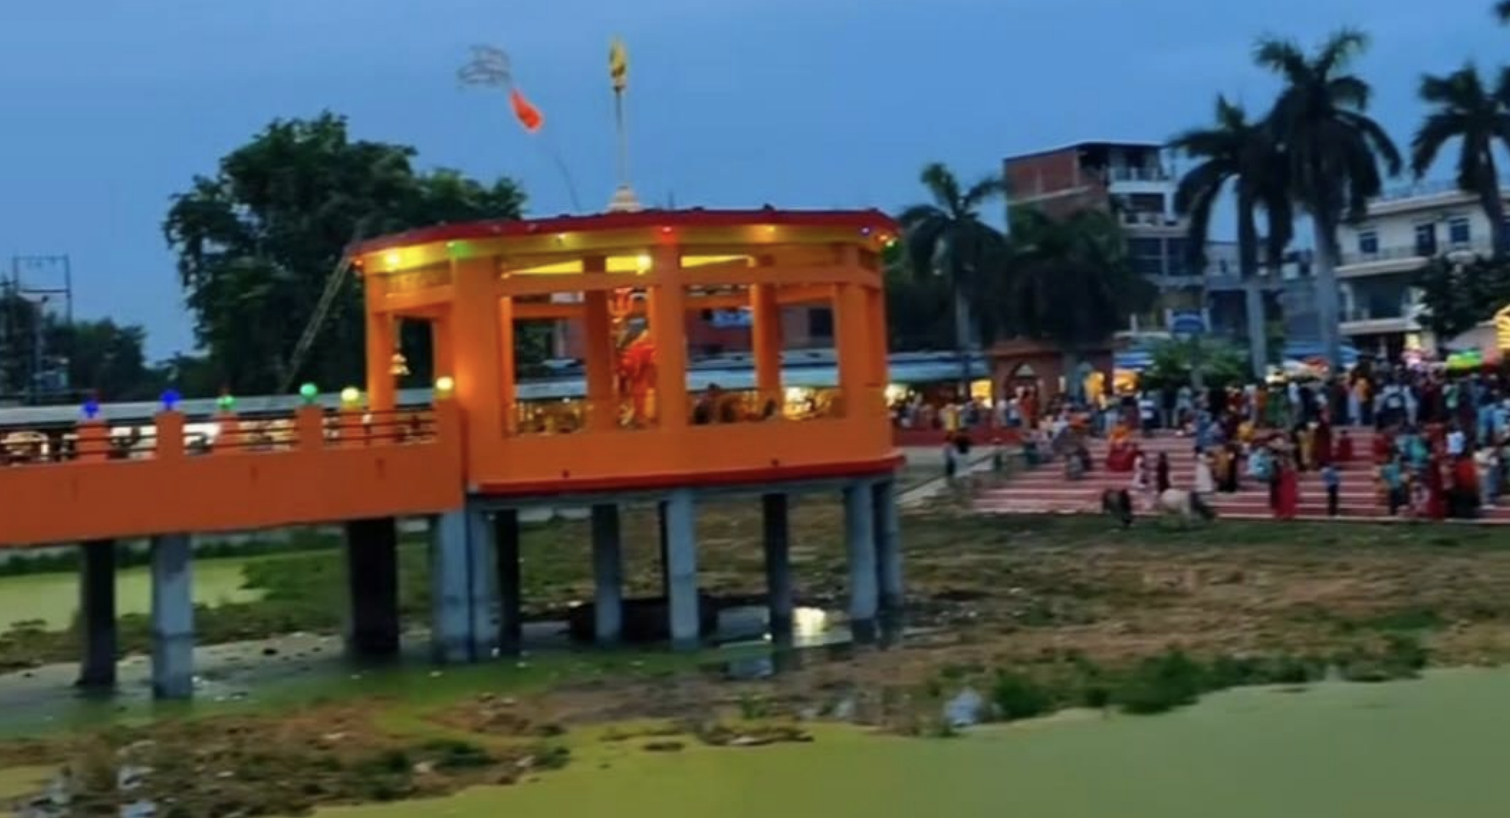
Rani Talau
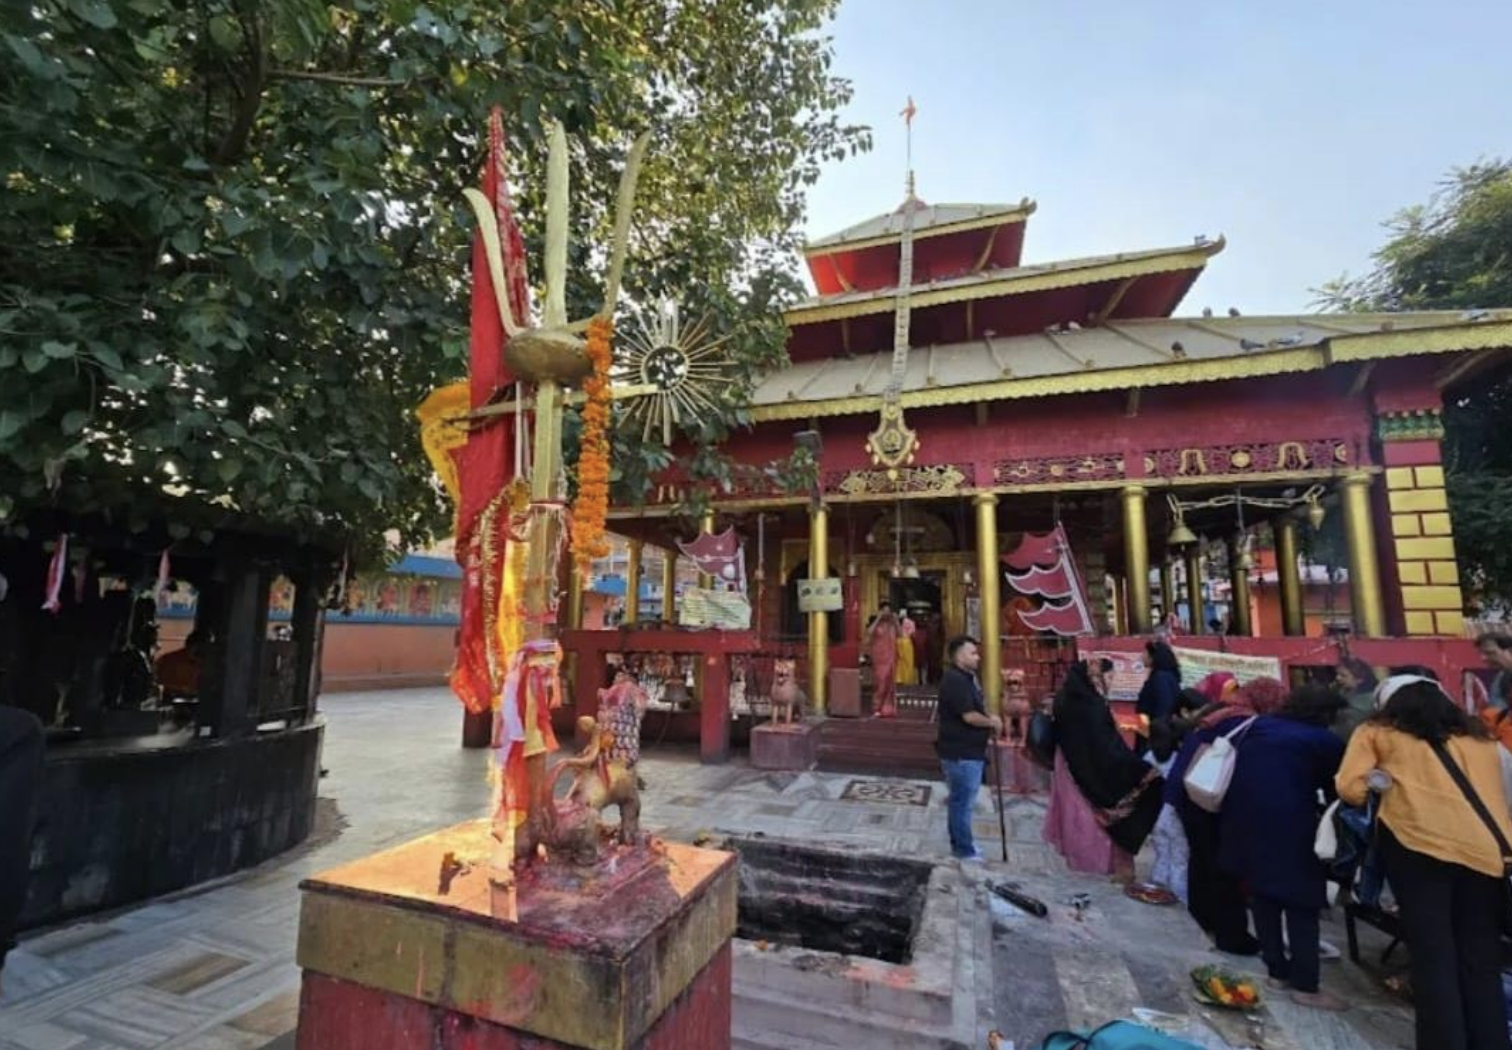
Bageshwori Temple
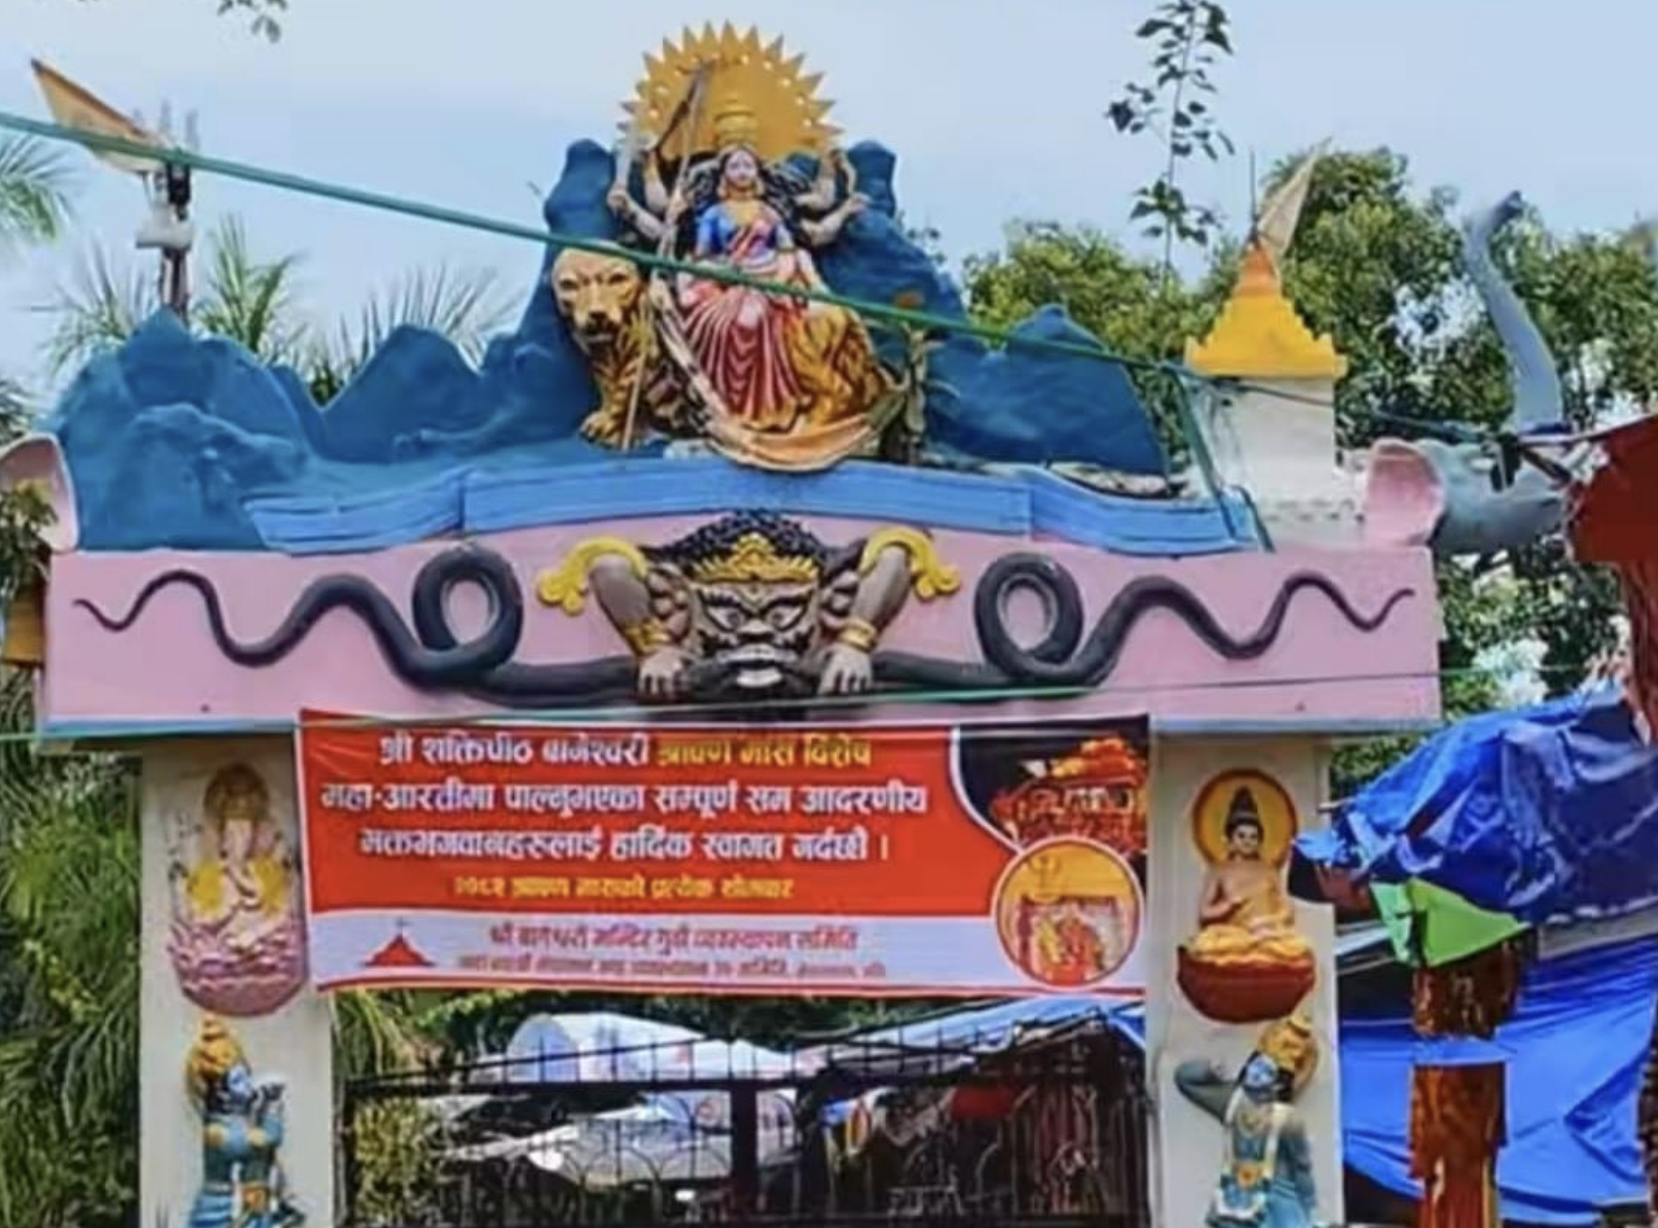
Temple
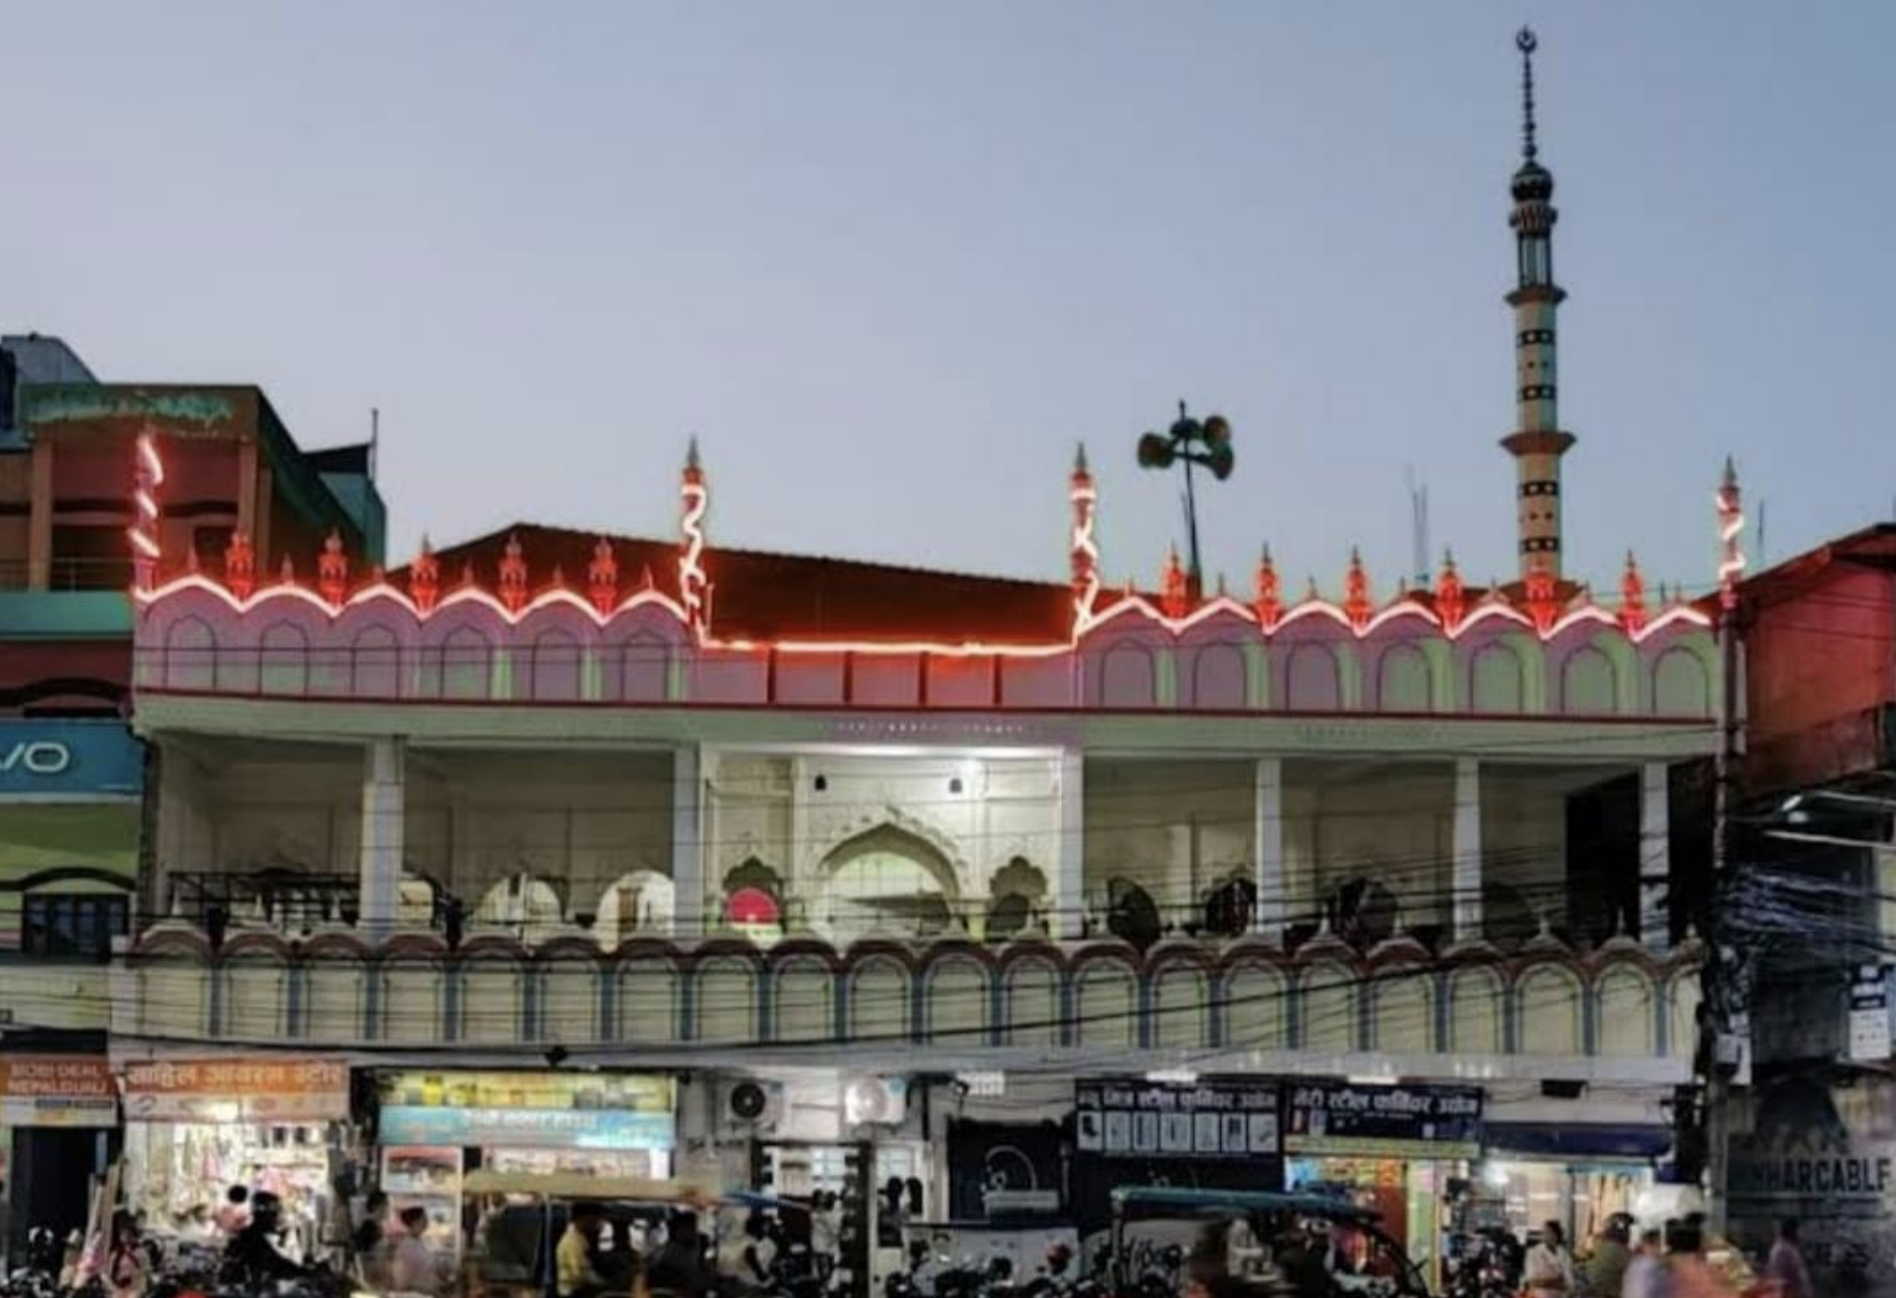
Dhamboji Masjid
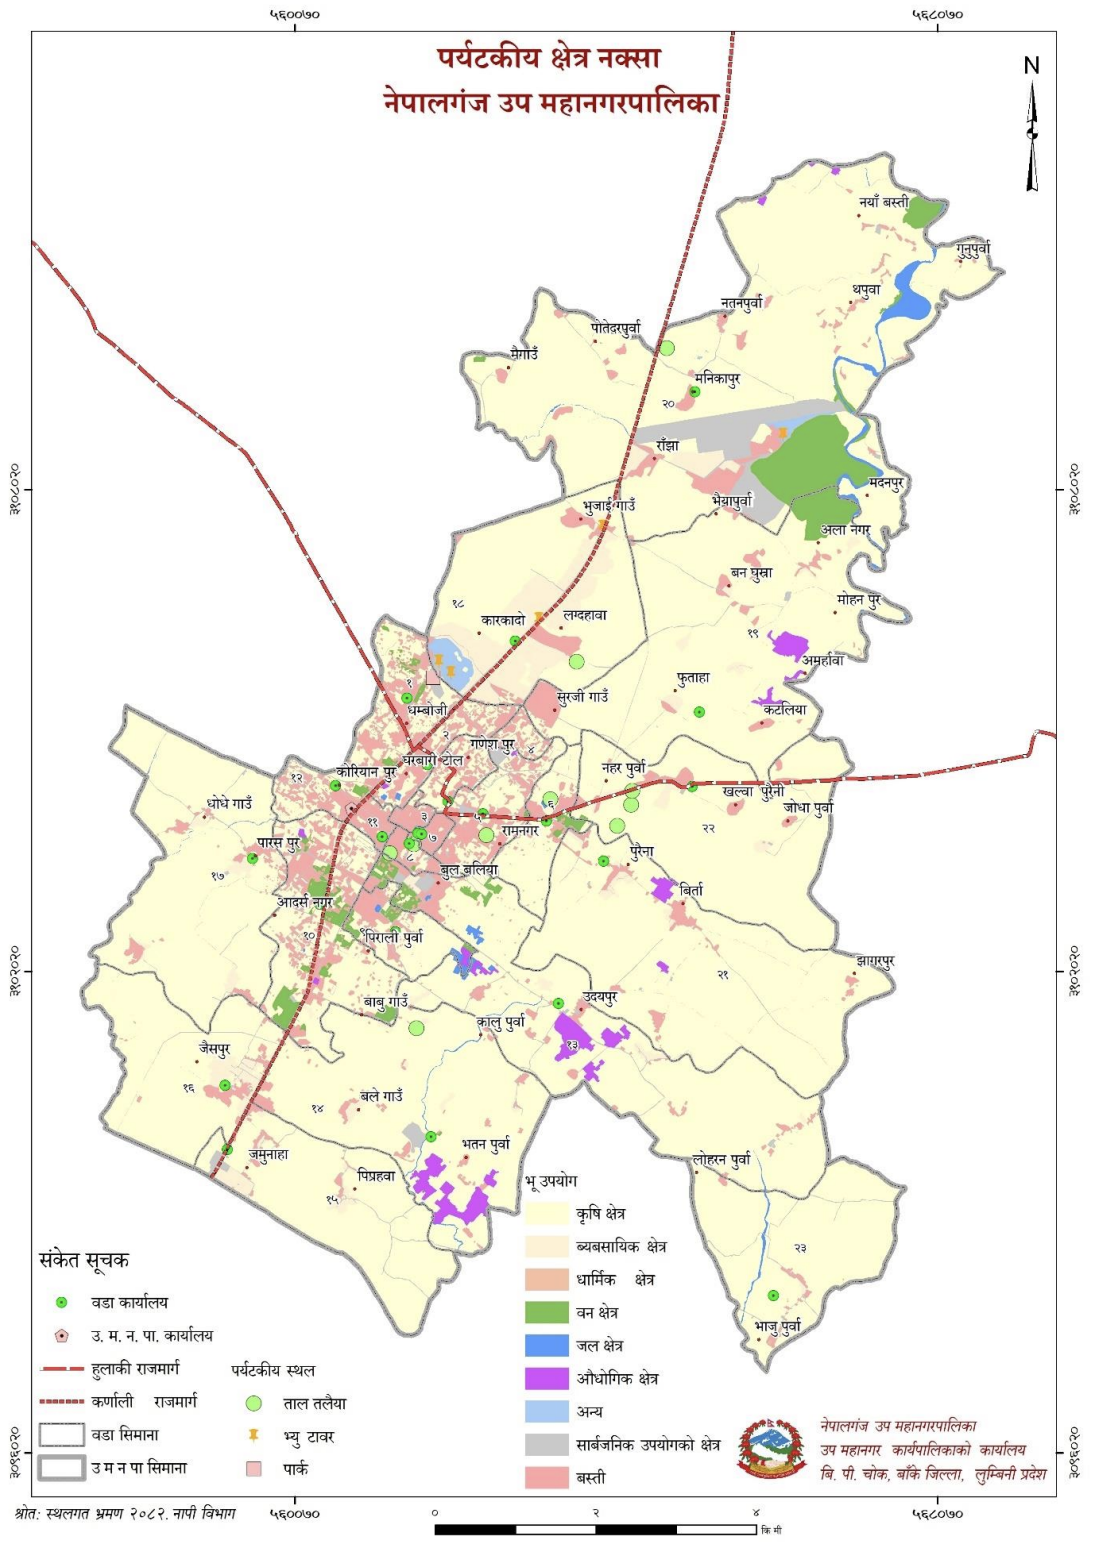
Map No. 6: Tourist Area Map of the Sub-Metropolitan City
4.7.2 Hotel, Resort and Restaurant Description
It is mandatory to properly develop all infrastructures related to a sector for the development of any sector. Although there is abundant potential for tourism in Nepal, the lack of tourism infrastructure has hindered the widespread development of the tourism sector. Tourism infrastructures include convenient transportation facilities, hotels, lodges and restaurants, tourist guides, information centers, rescue mechanisms, communication, security, and tourist activities. Looking at the prospect of tourism, it is indispensable to develop these infrastructures gradually based on the requirements for tourism development. The details of hotels, resorts and restaurants in this sub-metropolitan city are mentioned in Schedule 4.
4.8 Industry, Trade and Banking
After the development of agriculture, industry is the necessary sector for the economic revolution of any country. Although various efforts have been made since the Rana regime for industrial development, large-scale industries capable of bringing about an industrial revolution have not been able to open in Nepal. It is unfortunate that even existing industries are becoming sick and closing down. Only if we can establish industries based on agriculture and local raw materials along with the development of agriculture and advance the consumption of Nepalese products in the global market, will a base be prepared for Nepal to rise above an under-developed nation. In this sub-metropolitan city, small and large micro-enterprises and trade businesses are operating, while for banking services, more than 40 banks and financial institutions are active in transactions. To promote industry, it is equally necessary to prioritize and encourage small and medium industries based on local resources.
4.8.1 Industrial Development (Micro, Cottage, Small, Medium, Large Industry, Government, Public, Private and Cooperative)
Although various efforts have been made since the Rana regime for industrial development, large-scale industries capable of bringing about an industrial revolution have not been able to open in Nepal. It is unfortunate that even existing industries are becoming sick and closing down. Only if we can establish industries based on agriculture and local raw materials along with the development of agriculture and advance the consumption of Nepalese products in the global market, will a base be prepared for Nepal to rise above an under-developed nation. To promote industry, it is equally necessary to prioritize and encourage small and medium industries based on local resources.
Including small industries, all types of agro-based industries, cottage industries, medium industries, large industries, service-oriented industries, government industries, community-based industries, collection and processing industries, 9,024 trade businesses and industries have been formally registered and are operating in the sub-metropolitan city, while 786 hotels and businesses are registered and operating.
4.8.2 Trade/Business Description
Trade is a sector that is inextricably linked with the development of the agriculture and industry sectors. Since trade is the medium to bring goods produced through agriculture and industry to national and international markets, the development of trade and commerce is extremely important. In order to be economically strong, local levels must become strong in local production and reach a state where they can export. The economy cannot rise by trading goods produced outside of one's own area. For this, in one way or another, it is necessary to focus on local production and be able to export such products. The details of trade/businesses in this sub-metropolitan city are mentioned in the table.
| S.N. | Business Group | Number |
|---|---|---|
| 1 | Other Businesses | 84 |
| 2 | Other Services | 176 |
| 3 | Productive Industry | 121 |
| 4 | Cottage Industry and Other Industries | 411 |
| 5 | Construction Business | 221 |
| 6 | Wholesale and retail trade of items such as construction materials, computers, electrical goods, cameras, televisions, radios, carpets, petroleum products | 300 |
| 7 | Tourism Industry | 786 |
| 8 | Commercial Goods | 3701 |
| 9 | Maintenance Service | 379 |
| 10 | Financial Services and Non-Governmental Organizations | 230 |
| 11 | Expert Consulting and Other Professional Services | 118 |
| 12 | Education side | 259 |
| 13 | Vehicle Sellers | 163 |
| 14 | Service Industry | 323 |
| 15 | Communication Service | 11 |
| 16 | Health Service | 244 |
| 17 | Real Estate towards Housing Company and Real Estate Purchase/Sale | 15 |
| Total | 7482 |
4.8.3 Local Market and Commercial Centers
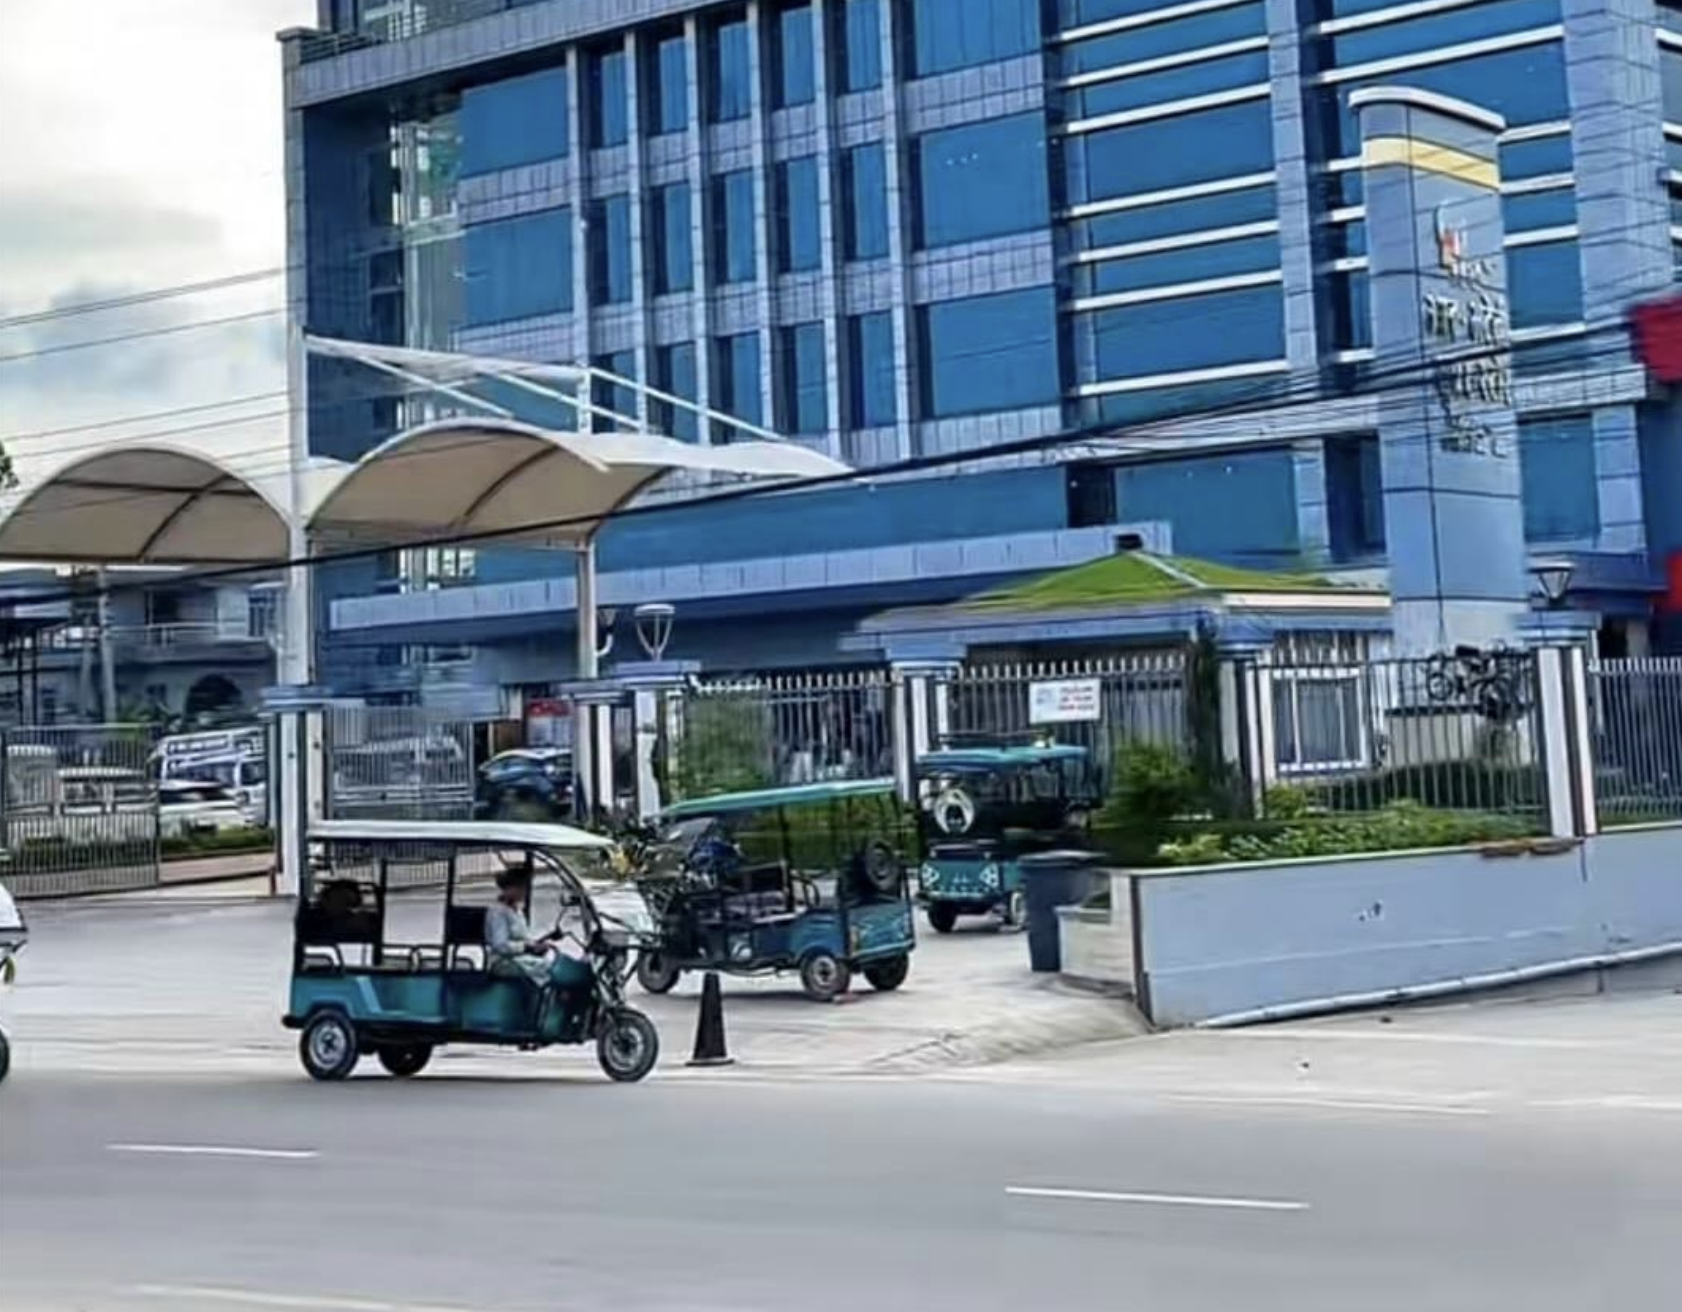
Market Area
Apart from the big cities of the country, in areas with dense settlements in rural areas, human activities such as education, health, other services, trade and commerce are found to be concentrated. Such centers are called market centers. Although they have not been fully developed from the perspective of urban development and facilities, such centers are found to be concentrating and developing human activities as areas that can be developed in the future. It is not that markets cannot be developed in new areas looking at suitability; however, it is easy to further develop such areas that have already been developed to some extent. The main commercial centers of this sub-metropolitan city are as follows.
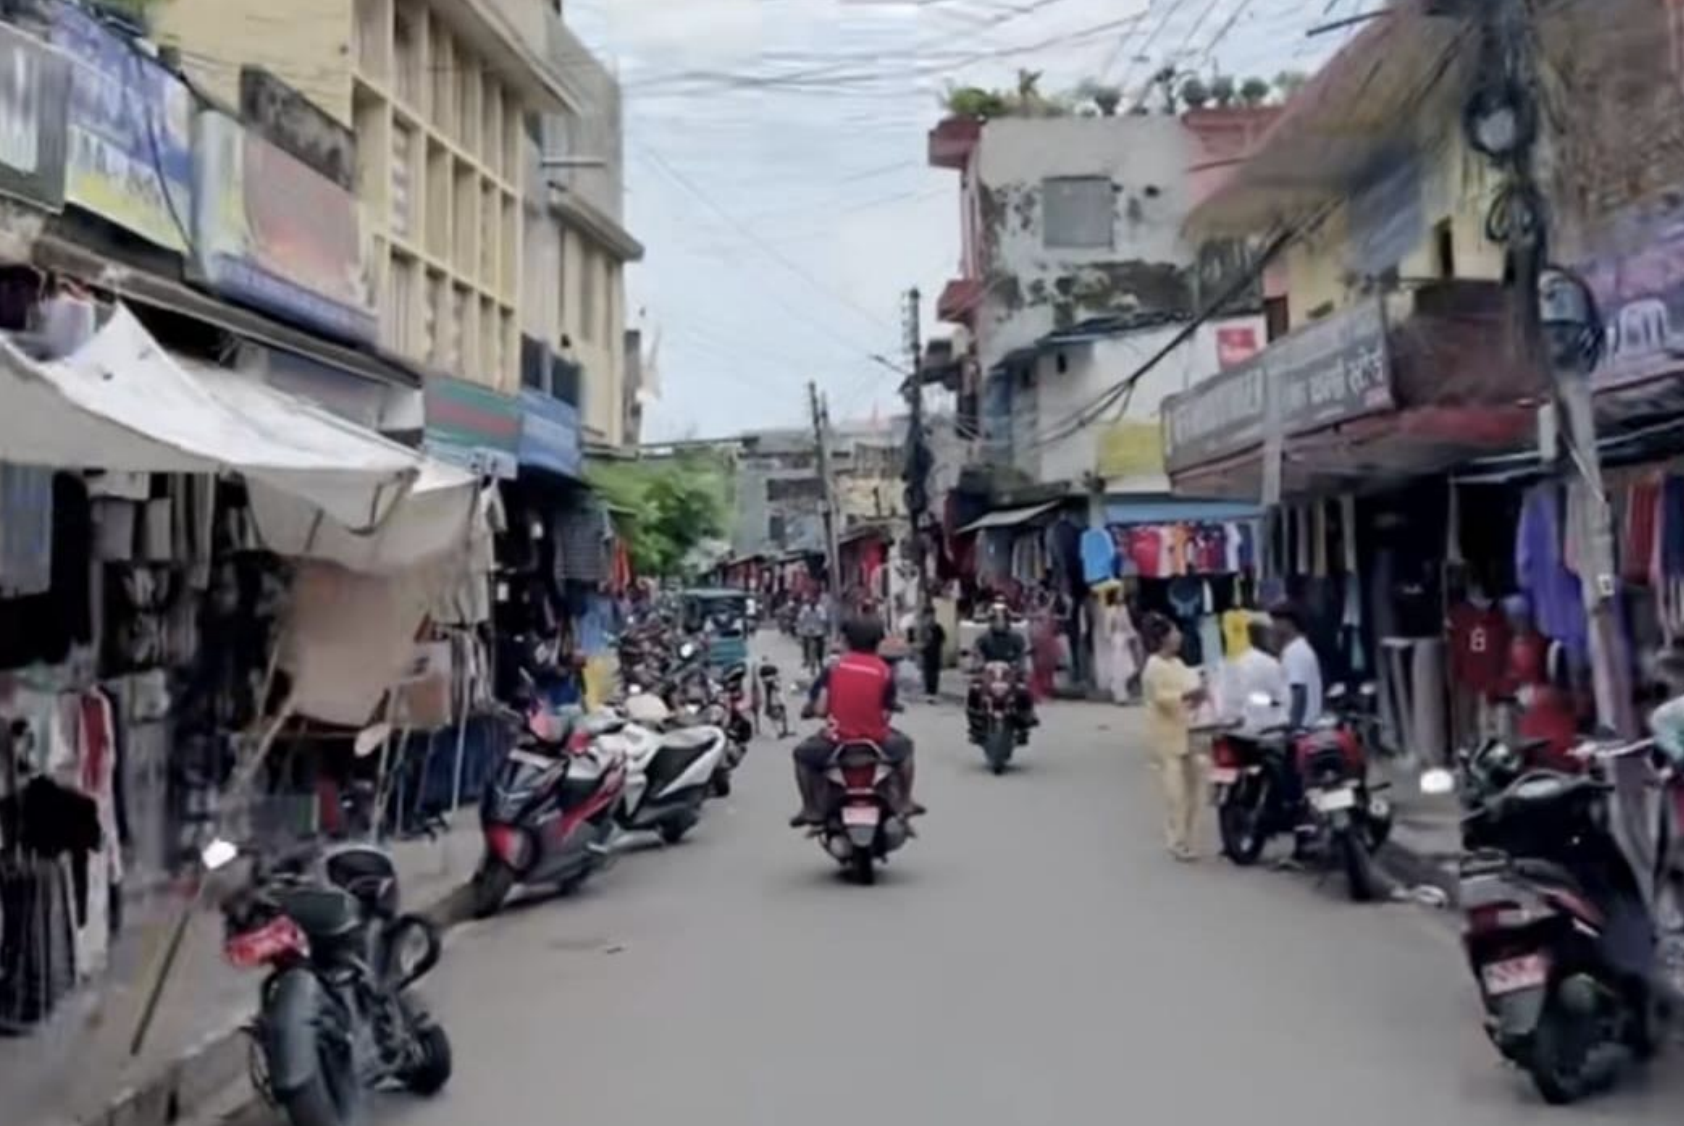
Gharbari Tole Market Area
| Ward No. | Commercial Area |
|---|---|
| 1 | Dhamboji, Khajura Road |
| 2 | Gharbari Tole |
| 3 | Surajline, Eklaini, Birendra Keshari Tole, Sonar Tole, Bishkoriyan Tole |
| 5 | Phultekra |
| 6 | Phultekra Area |
| 7 | Sahawa Mod, Pipal Chautara |
| 8 | Tribhuvan Chowk, Sadar Line |
| 9 | Ramlila Road, Charbahini Army Barrack, Electricity Office |
| 10 | Charbahini Chowk, Surkhet Road, Ganeshman Chowk Industrial Area |
| 11 | Surkhet Road, Pasang Marga, Sadar Line, Idgah Road, Sunar Mandi |
| 12 | B.P. Chowk Surkhet Road, Kaushalya Marga, Belaspur |
| 13 | Ramlila Maidan, Nepal Bank Road from Mero Hospital, Udayapur Chauraha |
| 14 | Balegaun, Babugaun, Chaulikka, Bhatanpurwa |
| 15 | Jamunaha Chauki |
| 16 | Bhansar, Kabrastan, Ismail Chowk, Shiva Temple |
| 17 | Paraspur, Bhruti Nagar |
| 18 | Karkado |
| 19 | Bhaiyapur, Sujigaun, Katalia, Alannagar, Mohanpur |
| 20 | Ranjha Airport |
| 21 | Nayanbasti, Birta |
| 22 | Shantichowk, Narapurwa, Pureni Bazar, Kasnital Chowk |
| 23 | Bekari Singh Purwa, Bhajjupurwa, Loharpurwa |
4.8.4 Bank and Financial Institution
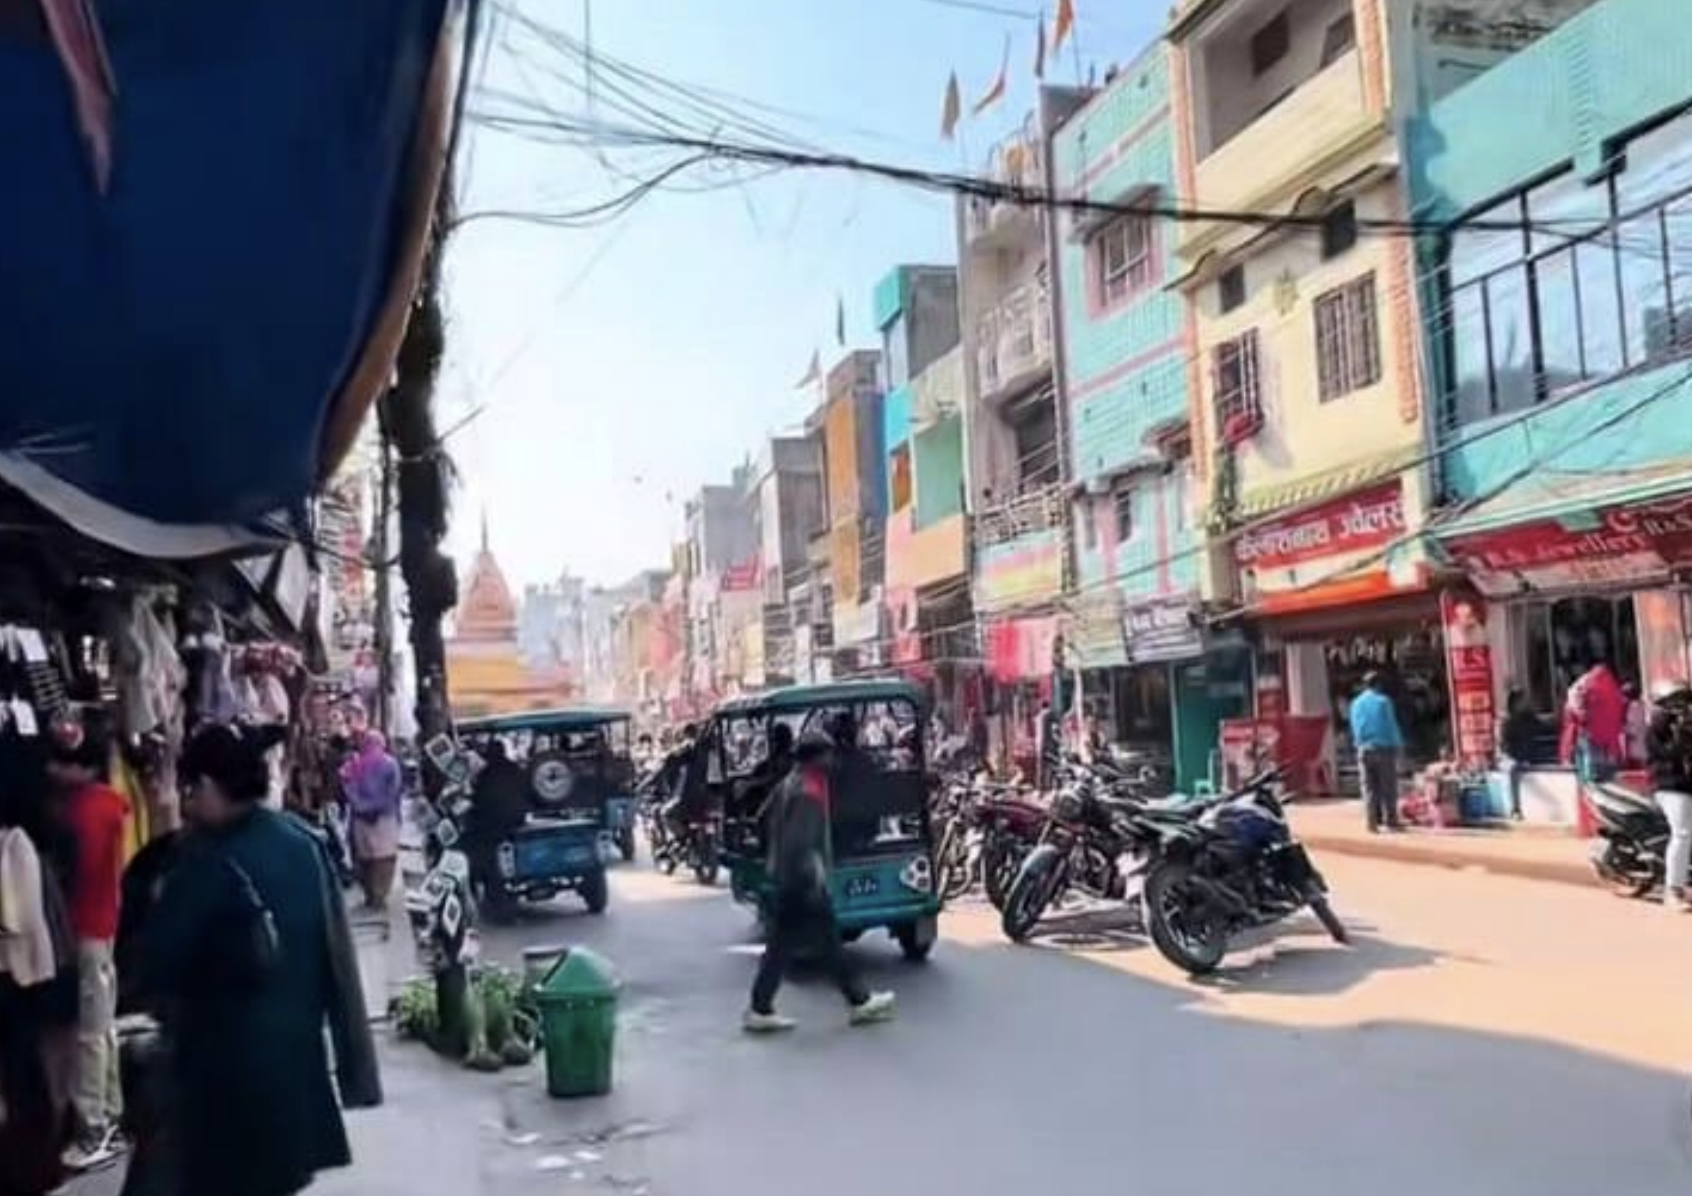
Sadar Line Road Bazar
4.8.4 Bank and Financial Institution Details
In a modern economy, when financial transactions take place through banks, it becomes systematic and easy. With the extensive development in banking systems, the services provided by them are also expanding. Currently, various banks have made arrangements for ATM services, Visa card services, bill payment services, and even insurance. In this sense, it has become essential to provide access to banking services to rural people in a modern economic system. In this sub-metropolitan city, banking transactions are conducted through 30 banks and financial institutions, while 111 cooperative societies are actively operating here. In addition to this, financial transactions are also conducted through various savings groups. The details of banks and financial institutions here are included in the table below.
| S.N. | Name of Bank and Financial Institution | Category |
|---|---|---|
| 1 | Nepal Bank Limited | Commercial Bank (A) |
| 2 | Rastriya Banijya Bank | Commercial Bank (A) |
| 3 | Nabil Bank | Commercial Bank (A) |
| 4 | Global IME Bank | Commercial Bank (A) |
| 5 | NIC Asia Bank | Commercial Bank (A) |
| 6 | Nepal Investment Mega Bank | Commercial Bank (A) |
| 7 | Himalayan Bank | Commercial Bank (A) |
| 8 | Everest Bank | Commercial Bank (A) |
| 9 | Prabhu Bank | Commercial Bank (A) |
| 10 | Kumari Bank | Commercial Bank (A) |
| 11 | Citizens Bank International | Commercial Bank (A) |
| 12 | Prime Commercial Bank | Commercial Bank (A) |
| 13 | Sanima Bank | Commercial Bank (A) |
| 14 | Machhapuchchhre Bank | Commercial Bank (A) |
| 15 | Standard Chartered Bank Nepal | Commercial Bank (A) |
| 16 | Karnali Development Bank | Development Bank (B) |
| 17 | Muktinath Bikas Bank | Development Bank (B) |
| 18 | Shine Resunga Development Bank | Development Bank (B) |
| 19 | Garima Bikas Bank | Development Bank (B) |
| 20 | Sangrila Development Bank | Development Bank (B) |
| 21 | ICFC Finance | Finance Company (C) |
| 22 | Manjushree Finance | Finance Company (C) |
| 23 | Best Finance Company | Finance Company (C) |
| 24 | Nirdhan Utthan Laghubitta | Microfinance (D) |
| 25 | Chhimek Laghubitta | Microfinance (D) |
| 26 | Deprosc Laghubitta | Microfinance (D) |
| 27 | Forward Microfinance | Microfinance (D) |
| 28 | Civil Laghubitta | Microfinance (D) |
| 29 | Sana Kisan Laghubitta | Microfinance (D) |
| 30 | Nerude Laghubitta | Microfinance (D) |
4.8.5 Cooperative Organizations
The role of cooperative societies in the economic and social development of the sub-metropolitan city is significant. Cooperative societies prevent local level savings from going out of the sub-metropolitan city and invest in various income-generating activities in the local area.
With the increase in people's ownership of cooperative societies and reduction in administrative hassles, people's access to the financial sector has also increased. Loan investment is made through savings and credit, agriculture, consumer, and multipurpose cooperative societies with the intention of investing in the city's industry and trade sector. At the same time, it is seen that these institutions have been regularly collecting savings from members. Loans from these cooperative societies are being invested in agriculture, industry, and trade sectors. The details of the cooperative societies in this sub-metropolitan city are mentioned in the table below.
| S.N. | Name of Cooperative Organization | Type | Address |
|---|---|---|---|
| 1 | Adarsh Tol Multipurpose Cooperative Soc. Ltd. | Multipurpose Cooperative | Ward No. 1 |
| 2 | Adarsh Bahumukhi Cooperative Soc. Ltd. | Bahumukhi Cooperative | Ward No. 1 |
| 3 | Triveni Swasthya Sewa Cooperative Soc. Ltd. | Health Service Cooperative | Ward No. 1 |
| 4 | Meherwan Consumer Cooperative Soc. Ltd. | Consumer Cooperative | Ward No. 1 |
| 5 | Indreni Saving and Credit Cooperative Soc. Ltd. | Saving and Credit | Ward No. 1 |
| 6 | Samaj Kalyan Saving and Credit Cooperative Soc. Ltd. | Saving and Credit | Ward No. 1 |
| 7 | Himalayan Saving and Credit Cooperative Soc. Ltd. | Saving and Credit | Ward No. 1 |
| 8 | Om Sai Saving and Credit Cooperative Soc. Ltd. | Saving and Credit | Ward No. 2 |
| 9 | Kuber Savings and Credit Cooperative Ltd. | Savings and Credit | Ward No. 2 |
| 10 | Nepalgunj Saving and Credit Cooperative Soc. Ltd. | Saving and Credit | Ward No. 2 |
| 11 | Panini Saving and Credit Cooperative Soc. Ltd. | Saving and Credit | Ward No. 2 |
| 12 | Prime Saving and Credit Cooperative Soc. Ltd. | Saving and Credit | Ward No. 2 |
| 13 | Mata Bageshwori Saving and Credit Cooperative Soc. Ltd. | Saving and Credit | Ward No. 2 |
| 14 | Krishnasar Agriculture Cooperative Soc. Ltd. | Agriculture Cooperative | Ward No. 2 |
| 15 | Jan-Jagriti Sanchar Cooperative Soc. Ltd. | Communication Cooperative | Ward No. 2 |
| 16 | Nagrik Saving and Credit Cooperative Soc. Ltd. | Saving and Credit | Ward No. 2 |
| 17 | Mega Saving and Credit Cooperative Soc. Ltd. | Saving and Credit | Ward No. 2 |
| 18 | Standard Savings and Credit Cooperative Ltd. | Savings and Credit | Ward No. 2 |
| 19 | Nav Laxmi Saving and Credit Cooperative Soc. Ltd. | Saving and Credit | Ward No. 3 |
| 20 | Siddha Kumakh Multipurpose Cooperative Soc. Ltd. | Multipurpose Cooperative | Ward No. 3 |
| 21 | Grihalaxmi Saving and Credit Cooperative Soc. Ltd. | Saving and Credit | Ward No. 4 |
| 22 | Grihini Multipurpose Cooperative Soc. Ltd. | Multipurpose Cooperative | Ward No. 4 |
| 23 | Jyoti Kunj Saving and Credit Cooperative Soc. Ltd. | Saving and Credit | Ward No. 4 |
| 24 | Taksar Saving and Credit Cooperative Soc. Ltd. | Saving and Credit | Ward No. 4 |
| 25 | Diamond Saving and Credit Cooperative Soc. Ltd. | Saving and Credit | Ward No. 4 |
| 26 | Labh Saving and Credit Cooperative Soc. Ltd. | Saving and Credit | Ward No. 4 |
| 27 | Ujyaalo Saving and Credit Cooperative Soc. Ltd. | Saving and Credit | Ward No. 4 |
| 28 | Chamkilo Tara Saving and Credit Cooperative Soc. Ltd. | Saving and Credit | Ward No. 4 |
| 29 | Chetana Multipurpose Cooperative Soc. Ltd. | Multipurpose Cooperative | Ward No. 4 |
| 30 | Laliguras Saving and Credit Cooperative Soc. Ltd. | Saving and Credit | Ward No. 4 |
| 31 | Sharada Consumer Cooperative Soc. Ltd. | Consumer Cooperative | Ward No. 4 |
| 32 | Sangathit Agriculture Cooperative Soc. Ltd. | Agriculture Cooperative | Ward No. 4 |
| 33 | Civil Savings and Credit Cooperative Ltd. | Savings and Credit | Ward No. 4 |
| 34 | Himshikhar Multipurpose Cooperative Soc. Ltd. | Multipurpose Cooperative | Ward No. 4 |
| 35 | Namuna Multipurpose Cooperative Soc. Ltd. | Multipurpose Cooperative | Ward No. 4 |
| 36 | Danfe Saving and Credit Cooperative Soc. Ltd. | Saving and Credit | Ward No. 5 |
| 37 | Future Saving and Credit Cooperative Soc. Ltd. | Saving and Credit | Ward No. 6 |
| 38 | Shanti Mahila Bikas Multipurpose Cooperative Soc. Ltd. | Multipurpose Cooperative | Ward No. 7 |
| 39 | Gurukul Saving and Credit Cooperative Soc. Ltd. | Saving and Credit | Ward No. 8 |
| 40 | Samanata Saving and Credit Cooperative Soc. Ltd. | Saving and Credit | Ward No. 8 |
| 41 | Arunodaya Saving and Credit Cooperative Soc. Ltd. | Saving and Credit | Ward No. 9 |
| 42 | Balaji Consumer Cooperative Soc. Ltd. | Consumer Cooperative | Ward No. 9 |
| 43 | Jan Utthan Multipurpose Cooperative Soc. Ltd. | Multipurpose | Ward No. 9 |
| 44 | Ramaroshan Saving and Credit Cooperative Soc. Ltd. | Saving and Credit | Ward No. 9 |
| 45 | Rastra Sewak Cooperative Soc. Ltd. | Sewak Cooperative | Ward No. 9 |
| 46 | Sundar Agriculture Cooperative Soc. Ltd. | Agriculture Cooperative | Ward No. 9 |
| 47 | Aashma Saving and Credit Cooperative Soc. Ltd. | Saving and Credit | Ward No. 10 |
| 48 | Udhyog Shramik Saving and Credit Cooperative Soc. Ltd. | Saving and Credit | Ward No. 10 |
| 49 | Global Saving and Credit Cooperative Soc. Ltd. | Saving and Credit | Ward No. 10 |
| 50 | Indravati Saving and Credit Cooperative Soc. Ltd. | Saving and Credit | Ward No. 10 |
| 51 | Shubhalaxmi Multipurpose Cooperative Soc. Ltd. | Multipurpose Cooperative | Ward No. 10 |
| 52 | Navjeevan Saving and Credit Cooperative Soc. Ltd. | Saving and Credit | Ward No. 10 |
| 53 | Samuhik Saving and Credit Cooperative Soc. Ltd. | Saving and Credit | Ward No. 10 |
| 54 | Sungava Swasthya Cooperative Soc. Ltd. | Health Cooperative | Ward No. 10 |
| 55 | Capital Saving and Credit Cooperative Soc. Ltd. | Saving and Credit | Ward No. 11 |
| 56 | Saphal Multipurpose Cooperative Soc. Ltd. | Multipurpose Cooperative | Ward No. 12 |
| 57 | Kalpabrixya Mahila Saving and Credit Cooperative Soc. Ltd. | Saving and Credit | Ward No. 12 |
| 58 | Purnima Multipurpose Cooperative Soc. Ltd. | Multipurpose Cooperative | Ward No. 12 |
| 59 | Madhyapaschim Saving and Credit Cooperative Soc. Ltd. | Saving and Credit | Ward No. 12 |
| 60 | Western Saving and Credit Cooperative Soc. Ltd. | Saving and Credit | Ward No. 12 |
| 61 | Awadh Agriculture Cooperative Soc. Ltd. | Agriculture Cooperative | Ward No. 12 |
| 62 | Unity Saving and Credit Cooperative Soc. Ltd. | Saving and Credit | Ward No. 12 |
| 63 | Hepon Saving and Credit Cooperative Soc. Ltd. | Saving and Credit | Ward No. 12 |
| 64 | Nav Uday Agriculture Cooperative Soc. Ltd. | Agriculture Cooperative | Ward No. 13 |
| 65 | Omkar Agriculture Cooperative Soc. Ltd. | Agriculture Cooperative | Ward No. 13 |
| 66 | Mahendranagar Agriculture Cooperative Soc. Ltd. | Agriculture Cooperative | Ward No. 14 |
| 67 | Srijana Mahila Bikas Multipurpose Cooperative Soc. Ltd. | Multipurpose Cooperative | Ward No. 14 |
| 68 | Suryodaya Aalu Utpadan Cooperative Soc. Ltd. | Agriculture Cooperative | Ward No. 14 |
| 69 | Muskan Agriculture Cooperative Soc. Ltd. | Agriculture Cooperative | Ward No. 15 |
| 70 | Hanuman Krishak Cooperative Soc. Ltd. | Agriculture Cooperative | Ward No. 15 |
| 71 | Jai Kisan Cooperative Soc. Ltd. | Agriculture Cooperative | Ward No. 15 |
| 72 | Raja Consumer Cooperative Soc. Ltd. | Consumer Cooperative | Ward No. 16 |
| 73 | Mahtab Multipurpose Cooperative Soc. Ltd. | Multipurpose Cooperative | Ward No. 16 |
| 74 | Jagriti Mahila Multipurpose Cooperative Soc. Ltd. | Multipurpose Cooperative | Ward No. 16 |
| 75 | Unnati Multipurpose Cooperative Soc. Ltd. | Multipurpose Cooperative | Ward No. 17 |
| 76 | Gausulwara Agriculture Cooperative Soc. Ltd. | Agriculture Cooperative | Ward No. 17 |
| 77 | Cheitanshil Agriculture Cooperative Soc. Ltd. | Agriculture Cooperative | Ward No. 17 |
| 78 | Jai Ma Bhawani Agriculture Cooperative Soc. Ltd. | Agriculture Cooperative | Ward No. 17 |
| 79 | Jai Maa Jwala Krishak Cooperative Soc. Ltd. | Agriculture Cooperative | Ward No. 17 |
| 80 | Jai Maa Durga Agriculture Cooperative Soc. Ltd. | Agriculture Cooperative | Ward No. 17 |
| 81 | Mahakali Agriculture Cooperative Soc. Ltd. | Agriculture Cooperative | Ward No. 17 |
| 82 | Lavkush Agriculture Cooperative Soc. Ltd. | Agriculture Cooperative | Ward No. 17 |
| 83 | Sadbhav Saving and Credit Cooperative Soc. Ltd. | Saving and Credit | Ward No. 17 |
| 84 | Samaj Utthan Agriculture Cooperative Soc. Ltd. | Agriculture Cooperative | Ward No. 17 |
| 85 | Jai Prithvi Agriculture Cooperative Soc. Ltd. | Agriculture Cooperative | Ward No. 18 |
| 86 | Udyamshilta Saving and Credit Cooperative Soc. Ltd. | Saving and Credit | Ward No. 18 |
| 87 | Phulteka Multipurpose Cooperative Soc. Ltd. | Multipurpose Cooperative | Ward No. 18 |
| 88 | Pashupati Multipurpose Cooperative Soc. Ltd. | Multipurpose Cooperative | Ward No. 18 |
| 89 | Sahara Saving and Credit Cooperative Soc. Ltd. | Saving and Credit | Ward No. 18 |
| 90 | Chhana Agriculture Cooperative Soc. Ltd. | Agriculture Cooperative | Ward No. 18 |
| 91 | Radha Krishna Agriculture Cooperative Soc. Ltd. | Agriculture Cooperative | Ward No. 19 |
| 92 | Bagwan Agriculture Cooperative Soc. Ltd. | Agriculture Cooperative | Ward No. 19 |
| 93 | Aalanagar Mahila Agriculture Cooperative Soc. Ltd. | Women Agriculture Cooperative | Ward No. 19 |
| 94 | Agragami Mahila Saving and Credit Cooperative Soc. Ltd. | Saving and Credit | Ward No. 20 |
| 95 | Kamaldas Baba Agriculture Cooperative Soc. Ltd. | Agriculture Cooperative | Ward No. 20 |
| 96 | Makhmali Mahila Bikas Multipurpose Cooperative Soc. Ltd. | Multipurpose Cooperative | Ward No. 20 |
| 97 | Shuddha Goras Dugdha Utpadak Cooperative Soc. Ltd. | Agriculture Cooperative | Ward No. 20 |
| 98 | Santoshi Mata Agriculture Cooperative Soc. Ltd. | Agriculture Cooperative | Ward No. 20 |
| 99 | Siddha Baba Agriculture Cooperative Soc. Ltd. | Agriculture Cooperative | Ward No. 20 |
| 100 | Shree Sworojgar Agriculture Cooperative Soc. Ltd. | Agriculture Cooperative | Ward No. 20 |
| 101 | Hamro Shivil Agriculture Cooperative Soc. Ltd. | Agriculture Cooperative | Ward No. 20 |
| 102 | Jamuna Agriculture Cooperative Soc. Ltd. | Agriculture Cooperative | Ward No. 21 |
| 103 | Sifa Agriculture Cooperative Soc. Ltd. | Agriculture Cooperative | Ward No. 21 |
| 104 | Naharpruwa Agriculture Cooperative Soc. Ltd. | Agriculture Cooperative | Ward No. 22 |
| 105 | Sana Kisan Agriculture Cooperative Soc. Ltd. | Agriculture Cooperative | Ward No. 22 |
| 106 | Kopila Mahila Agriculture Cooperative Soc. Ltd. | Agriculture Cooperative | Ward No. 22 |
| 107 | Kanti Pokhari Agriculture Cooperative Soc. Ltd. | Agriculture Cooperative | Ward No. 22 |
| 108 | Shree Jai Gurudev Consumer Cooperative Soc. Ltd. | Consumer Cooperative | Ward No. 22 |
| 109 | Kisan Agriculture Cooperative Soc. Ltd. | Agriculture Cooperative | Ward No. 23 |
| 110 | Bahumukhi Saxa Cooperative Soc. Ltd. | Bahumukhi Saxa Cooperative | |
| 111 | Banke Unesco Agriculture Cooperative Soc. Ltd. | Agriculture Cooperative |
Social Status
Education, health, drinking water, art & culture, and peace & security
5.1 Educational and Human Resource Development
Education plays a giant role in the social and economic development of any country. It is taken as an indicator of human development. In this regard, the educational status of the sub-metropolitan city is being showcased here. Education is the primary cornerstone of development; it's a universally accepted theory that developing the inherent talents of individuals through education brings positive change to society and the nation. The paramount role of the education sector is essential for creating an aware, disciplined, and productive workforce. In planning, education has been adopted as a policy-level medium for poverty alleviation and all-round human resource development. State policy also aims to develop education as a primary infrastructure of development, making it accessible and effective for all.
Mahendra Multiple Campus
According to the Constitution of Nepal 2072, Part 3, Article 31, Fundamental Rights regarding education provide the following arrangements:
Every citizen shall have the right to access basic education.
Every citizen shall have the right to compulsory and free basic education and free secondary education from the state.
Citizens with disabilities and economically disadvantaged citizens shall have the right to free higher education in accordance with the law.
Visually-impaired citizens shall have the right to free education through Braille script, and citizens with hearing or speaking impairments shall have the right to free education through sign language.
Every Nepali community residing in Nepal shall have the right to receive education in their mother tongue and for that purpose, establish and operate schools and educational institutions as per the law.
Adarsh Higher Secondary School
Despite grand debates on the constitution and plans, our education sector hasn't seen remarkable development when compared globally. Education must realize the vision of bringing practical changes in knowledge and skills, supporting the marginalized and disadvantaged, and empowering the voiceless to enrich the country. The characteristic of quality education is to help develop leadership capacity, a tireless spirit of teaching and learning, social and human values, and self-confidence. Such education should have an abundance of analytical and original thinking. Quality is more than just prescribed learning. Today, quality education is needed for practical change, faith in labor, life-oriented research, relevance, love for country and culture, moral responsibility, and the use of science in its original form. Through high-quality development in education, people's living standards can be raised through employment opportunities, industrial development, access to facilities, technological expansion, production-oriented agriculture, income-oriented business, and abundant utilization of local resources, which in turn strengthens the sub-metropolitan economy and supports social development.
Adarsh Secondary School (Building-2)
Alpine Management College
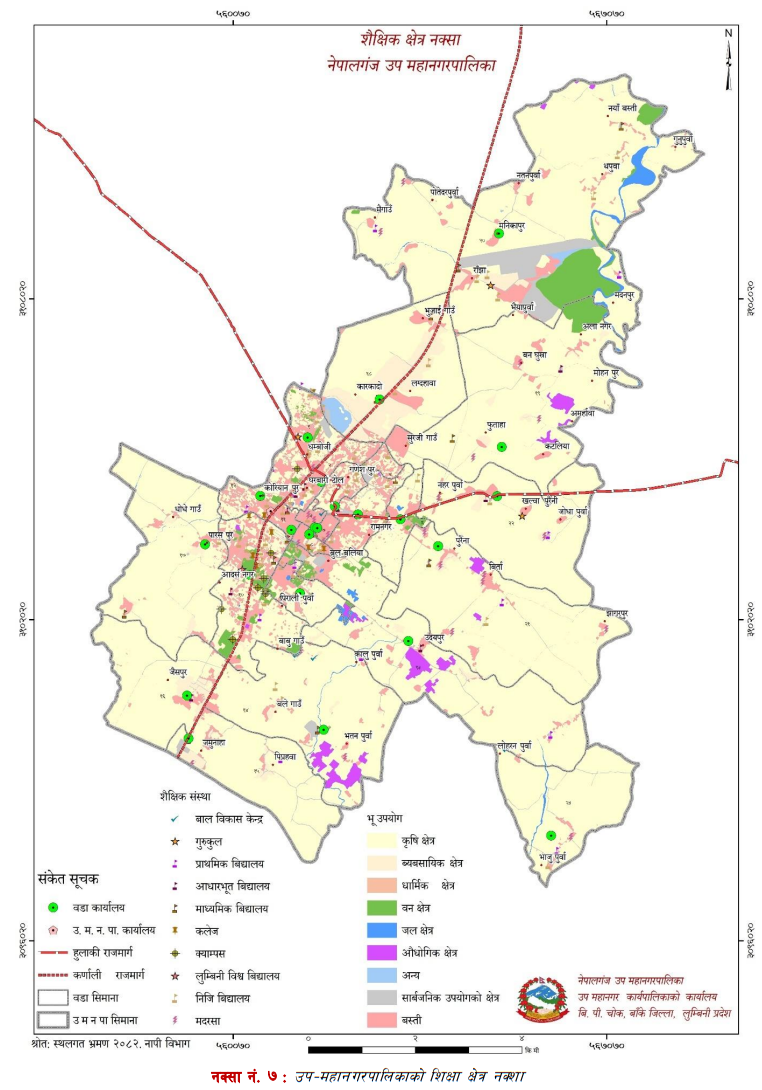
Map No. 7: Education Sector Map of the Sub-Metropolitan City
5.1.1 Literacy of Population Above Five Years
| Ward | Gender | Can Read & Write | Can Read Only | Cannot Read or Write | Not Stated | Total |
|---|---|---|---|---|---|---|
| 1 | Total | 7,352 | 67 | 985 | 2 | 8,406 |
| Male | 3,794 | 25 | 304 | 0 | 4,123 | |
| Female | 3,558 | 42 | 681 | 2 | 4,283 | |
| 2 | Total | 5,277 | 12 | 543 | 0 | 5,832 |
| Male | 2,759 | 6 | 196 | 0 | 2,961 | |
| Female | 2,518 | 6 | 347 | 0 | 2,871 | |
| ... (Wards 3-22 ...) | ... | ... | ... | ... | ... | ... |
| 23 | Total | 922 | 0 | 633 | 0 | 1,555 |
| Total | Male | 69,068 | 351 | 13,944 | 48 | 75,411 |
| Female | 53,641 | 412 | 20,922 | 64 | 75,039 | |
| Total | 114,709 | 763 | 34,866 | 112 | 150,450 | |
| Percentage | 76.24 | 0.51 | 23.17 | 0.07 | 100 |
Literacy indicates the overall human development index beyond just the skill to read and write. In the sub-metropolis, out of the total population of 150,450 aged 5 years and above, 114,709 or 76.24% are literate. The population that can only read is 763 or 0.51%, while the population that cannot read or write (illiterate) is 34,866 or 23.17%. The ward-wise detailed description is mentioned in the table.
Literacy Status of Population Aged 5 Years and Above
Tap bars or slices to view details
A) Literacy Status by Caste/Ethnicity
| Caste/Ethnicity | Can Read & Write | Can Read Only | Cannot Read or Write | Not Stated | Total | Percentage |
|---|---|---|---|---|---|---|
| Chhetri | 17,142 | 33 | 1,388 | 14 | 18,577 | 12.35 |
| Brahman-Hill | 9,115 | 19 | 476 | 4 | 9,614 | 6.39 |
| Magar | 5,177 | 10 | 525 | 4 | 5,716 | 3.80 |
| Tharu | 4,788 | 31 | 498 | 5 | 5,322 | 3.54 |
| Musalman | 26,547 | 408 | 15,085 | 25 | 42,065 | 27.96 |
| Total (All Groups) | 114,709 | 763 | 34,866 | 112 | 150,450 | 100 |
B) Literacy Status Based on Formal Education
UNESCO defined a literate person in 1956 as someone who can read and write with understanding and do basic daily calculations. Nepal also operates its literacy campaign based on this definition. In this sub-metropolis, out of the total population aged 5 to 25 years, 35,267 or 61.10% are currently attending schools or colleges, 12,799 or 22.18% previously attended schools or colleges, and 9,550 or 16.55% have never achieved formal education. Detailed descriptions are presented in the following tables.
| Ward | Gender | Currently Attending | Previously Attended | Never Attended | Not Stated | Total |
|---|---|---|---|---|---|---|
| 1 | Total | 1,900 | 432 | 116 | 2 | 2,450 |
| Male | 1,023 | 214 | 34 | 0 | 1,271 | |
| Female | 877 | 218 | 82 | 2 | 1,179 | |
| 2 | Total | 1,306 | 442 | 70 | 1 | 1,819 |
| Male | 702 | 222 | 32 | 1 | 957 | |
| Female | 604 | 220 | 38 | 0 | 862 | |
| ... (Wards 3-22 ...) | ... | ... | ... | ... | ... | ... |
| 23 | Total | 417 | 269 | 205 | 0 | 891 |
| Total | Male | 18,659 | 6,674 | 4,393 | 53 | 29,779 |
| Female | 16,608 | 6,125 | 5,157 | 48 | 27,938 | |
| Total | 35,267 | 12,799 | 9,550 | 101 | 57,717 | |
| Percentage | 61.10 | 22.18 | 16.55 | 0.17 | 100 |
Literacy Status Based on Formal Education (Ward-wise)
Tap bars or slices to view details
5.1.2 Educational Institutions and Students by Level
A) Community Schools and Students Detail
| S.N. | School Name | Ward No. | CDC (Girls) | CDC (Boys) | CDC (Total) | Class 1-5 (Girls) | Class 1-5 (Boys) | Class 1-5 (Total) | Class 6-8 (Girls) | Class 6-8 (Boys) | Class 6-8 (Total) | Class 9-10 (Girls) | Class 9-10 (Boys) | Class 9-10 (Total) | Class 11-12 (Girls) | Class 11-12 (Boys) | Class 11-12 (Total) |
|---|---|---|---|---|---|---|---|---|---|---|---|---|---|---|---|---|---|
| 1 | Adarsh Secondary School, Ranjha-Banke | 20 | 21 | 26 | 47 | 182 | 222 | 404 | 134 | 115 | 249 | 140 | 108 | 248 | 91 | 47 | 138 |
| 2 | Anathalaya Gaushia Secondary School | 4 | 15 | 26 | 41 | 54 | 117 | 171 | 4 | 37 | 41 | 3 | 18 | 21 | 0 | 0 | 0 |
| 3 | Arun Nepal Primary School | 13 | 83 | 78 | 161 | 216 | 125 | 341 | 35 | 21 | 56 | 0 | 0 | 0 | 0 | 0 | 0 |
| 4 | Bageshwari Primary School | 12 | 21 | 26 | 47 | 93 | 60 | 153 | 24 | 20 | 44 | 0 | 0 | 0 | 0 | 0 | 0 |
| 5 | Bal Mandir Primary School | 9 | 24 | 13 | 37 | 90 | 86 | 176 | 0 | 0 | 0 | 0 | 0 | 0 | 0 | 0 | 0 |
| 6 | Balmiki Basic School | 12 | 8 | 11 | 19 | 31 | 30 | 61 | 0 | 0 | 0 | 0 | 0 | 0 | 0 | 0 | 0 |
| 7 | Basic School Puraini | 22 | 33 | 12 | 45 | 144 | 127 | 271 | 44 | 41 | 85 | 0 | 0 | 0 | 0 | 0 | 0 |
| 8 | Basic School Jaisipur | 16 | 63 | 73 | 136 | 154 | 129 | 283 | 59 | 25 | 84 | 0 | 0 | 0 | 0 | 0 | 0 |
| 9 | Basic School Sangam Nagar | 18 | 12 | 8 | 20 | 25 | 21 | 46 | 0 | 0 | 0 | 0 | 0 | 0 | 0 | 0 | 0 |
| 10 | Basic School Suiya Piparaha | 15 | 17 | 18 | 35 | 96 | 100 | 196 | 0 | 0 | 0 | 0 | 0 | 0 | 0 | 0 | 0 |
| 11 | Bhawani Primary School Madanpur-20 | 20 | 3 | 3 | 6 | 4 | 6 | 10 | 0 | 0 | 0 | 0 | 0 | 0 | 0 | 0 | 0 |
| 12 | Darul Uloom Gulsan Madariya Jiyal Habib | 15 | 9 | 16 | 25 | 61 | 34 | 95 | 0 | 0 | 0 | 0 | 0 | 0 | 0 | 0 | 0 |
| 13 | Dhamboji Secondary School | 1 | 22 | 28 | 50 | 335 | 367 | 702 | 334 | 362 | 696 | 274 | 323 | 597 | 344 | 435 | 779 |
| 14 | Phulteka Secondary School | 6 | 20 | 23 | 43 | 106 | 114 | 220 | 67 | 67 | 134 | 23 | 25 | 48 | 0 | 0 | 0 |
| 15 | Gurukul Deb Sanskriti Gayatri Vidyapith Sanskriti | 1 | 0 | 0 | 0 | 29 | 33 | 62 | 0 | 0 | 0 | 0 | 0 | 0 | 0 | 0 | 0 |
| 16 | Gyan Sagar Secondary School | 17 | 85 | 94 | 179 | 202 | 166 | 368 | 99 | 69 | 168 | 33 | 25 | 58 | 0 | 0 | 0 |
| 17 | Hanuman Basic School | 10 | 2 | 11 | 13 | 54 | 51 | 105 | 0 | 0 | 0 | 0 | 0 | 0 | 0 | 0 | 0 |
| 18 | Jagat Jyoti Secondary School Basudevpur | 19 | 38 | 35 | 73 | 185 | 249 | 434 | 57 | 55 | 112 | 35 | 27 | 62 | 0 | 0 | 0 |
| 19 | Jaya Janata Secondary School | 20 | 19 | 31 | 50 | 128 | 117 | 245 | 94 | 115 | 209 | 74 | 85 | 159 | 68 | 57 | 125 |
| 20 | Karagar Basic School | 10 | 0 | 0 | 0 | 0 | 119 | 119 | 0 | 0 | 0 | 0 | 0 | 0 | 0 | 0 | 0 |
| 21 | Karna Baba Primary School | 21 | 48 | 32 | 80 | 71 | 86 | 157 | 0 | 0 | 0 | 0 | 0 | 0 | 0 | 0 | 0 |
| 22 | Lala Bhuwaneshwari Primary School | 13 | 27 | 21 | 48 | 57 | 28 | 85 | 0 | 0 | 0 | 0 | 0 | 0 | 0 | 0 | 0 |
| 23 | Secondary School Mahendra Nagar | 14 | 110 | 93 | 203 | 125 | 184 | 309 | 63 | 110 | 173 | 20 | 21 | 41 | 0 | 0 | 0 |
| 24 | Madrasa Ahmadiya Darul Islam | 22 | 0 | 0 | 0 | 61 | 58 | 119 | 0 | 0 | 0 | 0 | 0 | 0 | 0 | 0 | 0 |
| 25 | Maharaja Secondary School | 21 | 47 | 62 | 109 | 329 | 311 | 640 | 126 | 129 | 255 | 39 | 47 | 86 | 13 | 2 | 15 |
| 26 | Mahendra Secondary School Ranitalau | 7 | 15 | 12 | 27 | 88 | 142 | 230 | 57 | 122 | 179 | 50 | 75 | 125 | 79 | 91 | 170 |
| 27 | Mangal Secondary School | 8 | 35 | 24 | 59 | 156 | 280 | 436 | 239 | 481 | 720 | 225 | 462 | 687 | 627 | 555 | 1182 |
| 28 | Narayan Secondary School Nepalgunj | 11 | 10 | 11 | 21 | 67 | 135 | 202 | 40 | 103 | 143 | 35 | 51 | 86 | 29 | 62 | 91 |
| 29 | Navajyoti Boarding School | 14 | 34 | 60 | 94 | 51 | 66 | 117 | 2 | 2 | 4 | 0 | 0 | 0 | 0 | 0 | 0 |
| 30 | N.R. Primary School Faltupuriya | 14 | 18 | 12 | 30 | 104 | 80 | 184 | 0 | 0 | 0 | 0 | 0 | 0 | 0 | 0 | 0 |
| 31 | Nepal Rastriya Secondary School | 19 | 36 | 38 | 74 | 131 | 123 | 254 | 57 | 74 | 131 | 43 | 40 | 83 | 0 | 0 | 0 |
| 32 | Nepal Rastriya Basic School | 20 | 24 | 33 | 57 | 106 | 80 | 186 | 42 | 35 | 77 | 0 | 0 | 0 | 0 | 0 | 0 |
| 33 | Nepalgunj Kanya Secondary School | 4 | 61 | 0 | 61 | 323 | 0 | 323 | 143 | 0 | 143 | 100 | 0 | 100 | 14 | 0 | 14 |
| 34 | Pateshwari Basic School | 18 | 24 | 30 | 54 | 98 | 100 | 198 | 72 | 57 | 129 | 0 | 0 | 0 | 0 | 0 | 0 |
| 35 | Primary School Bageshwari Tol | 2 | 12 | 12 | 24 | 18 | 17 | 35 | 0 | 0 | 0 | 0 | 0 | 0 | 0 | 0 | 0 |
| 36 | Primary School Fingriyanpurwa | 22 | 35 | 40 | 75 | 117 | 113 | 230 | 0 | 0 | 0 | 0 | 0 | 0 | 0 | 0 | 0 |
| 37 | Primary School Jangalisinh Purwa | 23 | 28 | 40 | 68 | 127 | 190 | 317 | 0 | 0 | 0 | 0 | 0 | 0 | 0 | 0 | 0 |
| 38 | Ram Janaki N. Primary School | 20 | 11 | 11 | 22 | 30 | 25 | 55 | 0 | 0 | 0 | 0 | 0 | 0 | 0 | 0 | 0 |
| 39 | Ram Janaki Rastriya Primary School Pharkado | 18 | 13 | 7 | 20 | 48 | 31 | 79 | 0 | 0 | 0 | 0 | 0 | 0 | 0 | 0 | 0 |
| 40 | Sharda Basic School | 10 | 16 | 17 | 33 | 86 | 96 | 182 | 38 | 63 | 101 | 0 | 0 | 0 | 0 | 0 | 0 |
| 41 | Saraswati Secondary School Nepalgunj | 10 | 0 | 0 | 0 | 269 | 0 | 269 | 211 | 0 | 211 | 126 | 0 | 126 | 62 | 0 | 62 |
| 42 | Saraswati Primary School Bankegaun | 9 | 10 | 14 | 24 | 62 | 69 | 131 | 0 | 0 | 0 | 0 | 0 | 0 | 0 | 0 | 0 |
| 43 | Shree Deutadin Secondary School | 18 | 11 | 20 | 31 | 87 | 99 | 186 | 52 | 57 | 109 | 48 | 20 | 68 | 0 | 0 | 0 |
| 44 | Shree Hanuman Basic School | 15 | 34 | 36 | 70 | 118 | 132 | 250 | 16 | 21 | 37 | 0 | 0 | 0 | 0 | 0 | 0 |
| 45 | Shree Nepal Rastriya Basic School | 2 | 9 | 14 | 23 | 62 | 60 | 122 | 29 | 30 | 59 | 0 | 0 | 0 | 0 | 0 | 0 |
| 46 | Yuddha Sanskriti Secondary School | 10 | 8 | 12 | 20 | 39 | 41 | 80 | 17 | 33 | 50 | 10 | 11 | 21 | 0 | 0 | 0 |
| Total | 1,171 | 1,183 | 2,354 | 5,019 | 4,819 | 9,838 | 2,155 | 2,244 | 4,399 | 1,278 | 1,346 | 2,624 | 1,327 | 1,249 | 2,576 |
B) Institutional Schools and Students Detail
| S.N. | School Name | Ward No. | CDC (Girls) | CDC (Boys) | CDC (Total) | Class 1-5 (Girls) | Class 1-5 (Boys) | Class 1-5 (Total) | Class 6-8 (Girls) | Class 6-8 (Boys) | Class 6-8 (Total) | Class 9-10 (Girls) | Class 9-10 (Boys) | Class 9-10 (Total) | Class 11-12 (Girls) | Class 11-12 (Boys) | Class 11-12 (Total) |
|---|---|---|---|---|---|---|---|---|---|---|---|---|---|---|---|---|---|
| 1 | A.B.C. Residential School | 4 | 122 | 155 | 277 | 125 | 189 | 314 | 71 | 89 | 160 | 30 | 48 | 78 | 14 | 34 | 48 |
| 2 | Adarsh Secondary School | 10 | 66 | 64 | 130 | 195 | 301 | 496 | 113 | 133 | 246 | 68 | 97 | 165 | 409 | 399 | 808 |
| 3 | Angel Secondary School | 2 | 23 | 35 | 58 | 162 | 228 | 390 | 84 | 140 | 224 | 46 | 78 | 124 | 0 | 0 | 0 |
| 4 | Arunima Vidya Sadan | 6 | 51 | 83 | 134 | 42 | 75 | 117 | 0 | 0 | 0 | 0 | 0 | 0 | 0 | 0 | 0 |
| 5 | Baijapur Youth Vision Secondary English Medium School | 4 | 49 | 82 | 131 | 103 | 138 | 241 | 46 | 64 | 110 | 14 | 17 | 31 | 0 | 0 | 0 |
| 6 | Banke Shiksha Secondary School | 10 | 16 | 21 | 37 | 24 | 38 | 62 | 8 | 10 | 18 | 0 | 0 | 0 | 0 | 0 | 0 |
| 7 | Bheri English Medium Secondary School | 1 | 37 | 47 | 84 | 47 | 64 | 111 | 27 | 39 | 66 | 16 | 25 | 41 | 0 | 0 | 0 |
| 8 | Bhrikuti Secondary School | 1 | 31 | 44 | 75 | 43 | 65 | 108 | 9 | 20 | 29 | 0 | 0 | 0 | 0 | 0 | 0 |
| 9 | Vinayak Educational Academy | 9 | 64 | 118 | 182 | 65 | 104 | 169 | 20 | 48 | 68 | 6 | 25 | 31 | 0 | 0 | 0 |
| 10 | Virat Gurukul English Medium School | 20 | 22 | 21 | 43 | 45 | 75 | 120 | 12 | 22 | 34 | 9 | 12 | 21 | 0 | 0 | 0 |
| 11 | Bright Hope Academy Nepalgunj | 18 | 22 | 23 | 45 | 165 | 190 | 355 | 51 | 69 | 120 | 11 | 17 | 28 | 0 | 0 | 0 |
| 12 | Bright Land Secondary School | 10 | 34 | 67 | 101 | 166 | 253 | 419 | 101 | 164 | 265 | 57 | 101 | 158 | 162 | 237 | 399 |
| 13 | British English Boarding School | 19 | 32 | 43 | 75 | 42 | 65 | 107 | 15 | 33 | 48 | 12 | 16 | 28 | 0 | 0 | 0 |
| 14 | City Public Secondary School | 11 | 33 | 60 | 93 | 31 | 39 | 70 | 11 | 15 | 26 | 8 | 14 | 22 | 36 | 35 | 71 |
| 15 | Creative Children Home | 11 | 20 | 35 | 55 | 0 | 0 | 0 | 0 | 0 | 0 | 0 | 0 | 0 | 0 | 0 | 0 |
| 16 | Dakar English Boarding School | 20 | 53 | 68 | 121 | 62 | 61 | 123 | 23 | 27 | 50 | 6 | 5 | 11 | 0 | 0 | 0 |
| 17 | Daniel English Boarding School | 14 | 43 | 89 | 132 | 37 | 79 | 116 | 0 | 0 | 0 | 0 | 0 | 0 | 0 | 0 | 0 |
| 18 | Darul Madina | 5 | 124 | 115 | 239 | 71 | 60 | 131 | 0 | 0 | 0 | 0 | 0 | 0 | 0 | 0 | 0 |
| 19 | Dreamland English Medium High School | 20 | 0 | 0 | 0 | 112 | 183 | 295 | 62 | 86 | 148 | 23 | 40 | 63 | 0 | 0 | 0 |
| 20 | Euro Baby Zone School | 24 | 6 | 8 | 14 | 21 | 40 | 61 | 0 | 0 | 0 | 0 | 0 | 0 | 0 | 0 | 0 |
| 21 | Golden ABC Academy Banke H.S. | 4 | 80 | 129 | 209 | 272 | 508 | 780 | 127 | 216 | 343 | 103 | 99 | 202 | 0 | 0 | 0 |
| 22 | Grace Public School Nepalgunj | 4 | 43 | 50 | 93 | 69 | 106 | 175 | 23 | 41 | 64 | 9 | 14 | 23 | 11 | 8 | 19 |
| 23 | Gyanodaya Vidya Niketan English Medium School | 9 | 29 | 33 | 62 | 117 | 160 | 277 | 38 | 76 | 114 | 36 | 54 | 90 | 323 | 434 | 757 |
| 24 | Happy Hope English Medium School | 22 | 124 | 184 | 308 | 106 | 213 | 319 | 34 | 52 | 86 | 8 | 16 | 24 | 0 | 0 | 0 |
| 25 | Himalayan Academy | 20 | 113 | 145 | 258 | 111 | 128 | 239 | 27 | 32 | 59 | 0 | 0 | 0 | 0 | 0 | 0 |
| 26 | Holyland English Secondary School | 10 | 49 | 92 | 141 | 108 | 122 | 230 | 56 | 64 | 120 | 30 | 48 | 78 | 67 | 97 | 164 |
| 27 | Hope International Academy | 2 | 4 | 3 | 7 | 121 | 200 | 321 | 42 | 85 | 127 | 25 | 56 | 81 | 36 | 53 | 89 |
| 28 | Ideal Public Secondary School | 7 | 122 | 181 | 303 | 338 | 426 | 764 | 111 | 119 | 230 | 49 | 47 | 96 | 49 | 41 | 90 |
| 29 | Institute of Crystal Knowledge Boarding School | 6 | 44 | 49 | 93 | 147 | 255 | 402 | 45 | 72 | 117 | 19 | 28 | 47 | 0 | 0 | 0 |
| 30 | Islamic Children Academy | 3 | 24 | 22 | 46 | 23 | 20 | 43 | 6 | 0 | 6 | 0 | 0 | 0 | 0 | 0 | 0 |
| 31 | Jayabageshwari Vidya Niketan Pvt. Ltd. | 17 | 41 | 88 | 129 | 54 | 151 | 205 | 17 | 42 | 59 | 8 | 12 | 20 | 0 | 0 | 0 |
| 32 | Jayabageshwari Higher Secondary School Surkhet Road | 2 | 81 | 118 | 207 | 106 | 146 | 252 | 63 | 93 | 156 | 56 | 67 | 123 | 47 | 70 | 117 |
| 33 | J.C. Bal Sansar English Medium School | 5 | 4 | 2 | 6 | 66 | 102 | 168 | 0 | 0 | 0 | 0 | 0 | 0 | 0 | 0 | 0 |
| 34 | Junior Cambridge Secondary School | 6 | 34 | 70 | 104 | 125 | 245 | 370 | 32 | 42 | 74 | 6 | 16 | 22 | 4 | 4 | 8 |
| 35 | Junior Cambridge Secondary School | 7 | 19 | 23 | 42 | 56 | 63 | 119 | 27 | 30 | 57 | 9 | 19 | 28 | 0 | 0 | 0 |
| 36 | Kamal Pokhari English Medium Boarding School | 20 | 15 | 23 | 38 | 11 | 34 | 45 | 0 | 0 | 0 | 0 | 0 | 0 | 0 | 0 | 0 |
| 37 | Kids Kingdom Nepalgunj | 4 | 84 | 91 | 175 | 79 | 70 | 149 | 0 | 0 | 0 | 0 | 0 | 0 | 0 | 0 | 0 |
| 38 | Little Horizon Montessori School | 4 | 29 | 40 | 69 | 0 | 0 | 0 | 0 | 0 | 0 | 0 | 0 | 0 | 0 | 0 | 0 |
| 39 | Little Oxford English Secondary School | 5 | 30 | 72 | 102 | 42 | 63 | 105 | 19 | 21 | 40 | 2 | 1 | 3 | 0 | 0 | 0 |
| 40 | Living Stone Academy Nepalgunj | 6 | 29 | 30 | 59 | 25 | 21 | 46 | 7 | 10 | 17 | 0 | 0 | 0 | 0 | 0 | 0 |
| 41 | Lotus English Boarding School | 2 | 38 | 41 | 79 | 55 | 65 | 120 | 27 | 42 | 69 | 24 | 18 | 42 | 0 | 0 | 0 |
| 42 | Madrasa Jamia Darul Uloom Islamia | 16 | 0 | 0 | 0 | 43 | 31 | 74 | 0 | 0 | 0 | 0 | 0 | 0 | 0 | 0 | 0 |
| 43 | Manakamana English Boarding School | 18 | 87 | 105 | 192 | 117 | 162 | 279 | 67 | 69 | 136 | 24 | 29 | 53 | 1 | 1 | 2 |
| 44 | Marigold English Boarding School | 19 | 65 | 85 | 150 | 74 | 131 | 205 | 31 | 59 | 90 | 14 | 20 | 34 | 5 | 3 | 8 |
| 45 | Mayasadan Resident Boarding School | 22 | 46 | 81 | 127 | 53 | 97 | 150 | 9 | 21 | 30 | 0 | 0 | 0 | 0 | 0 | 0 |
| 46 | Mero Tuki Prajalaya | 1 | 21 | 27 | 48 | 8 | 7 | 15 | 0 | 0 | 0 | 0 | 0 | 0 | 0 | 0 | 0 |
| 47 | Modern Creative Children Zone | 19 | 35 | 48 | 83 | 0 | 0 | 0 | 0 | 0 | 0 | 0 | 0 | 0 | 0 | 0 | 0 |
| 48 | Modern Public English Boarding School | 12 | 50 | 78 | 128 | 82 | 124 | 206 | 41 | 79 | 120 | 31 | 54 | 85 | 129 | 119 | 248 |
| 49 | Montessori Smart Kids | 10 | 68 | 52 | 120 | 32 | 31 | 63 | 0 | 0 | 0 | 0 | 0 | 0 | 0 | 0 | 0 |
| 50 | Muntara English Medium High School | 20 | 47 | 83 | 130 | 74 | 144 | 218 | 41 | 58 | 99 | 22 | 28 | 50 | 0 | 0 | 0 |
| 51 | Nepal Academy English Medium School | 21 | 30 | 91 | 121 | 15 | 29 | 44 | 0 | 0 | 0 | 0 | 0 | 0 | 0 | 0 | 0 |
| 52 | Nepalgunj Model Academy | 18 | 67 | 91 | 158 | 169 | 286 | 455 | 97 | 111 | 208 | 45 | 74 | 119 | 55 | 69 | 124 |
| 53 | Nepalgunj St. Xavier School | 1 | 103 | 184 | 288 | 103 | 144 | 247 | 36 | 96 | 132 | 22 | 50 | 72 | 96 | 144 | 240 |
| 54 | New Assembly of God English Boarding School | 13 | 42 | 111 | 151 | 39 | 60 | 99 | 0 | 0 | 0 | 0 | 0 | 0 | 0 | 0 | 0 |
| 55 | New Galaxy School Nepalgunj | 10 | 12 | 12 | 24 | 55 | 96 | 151 | 20 | 26 | 46 | 7 | 12 | 19 | 0 | 0 | 0 |
| 56 | New Vision English Boarding School | 8 | 19 | 34 | 53 | 23 | 20 | 43 | 0 | 0 | 0 | 0 | 0 | 0 | 0 | 0 | 0 |
| 57 | Nirmal Jyoti English Boarding School Mohanpur | 19 | 32 | 33 | 65 | 28 | 46 | 74 | 0 | 0 | 0 | 0 | 0 | 0 | 0 | 0 | 0 |
| 58 | Pashupati English Boarding School | 20 | 44 | 69 | 113 | 122 | 188 | 310 | 85 | 125 | 210 | 52 | 76 | 128 | 0 | 1 | 1 |
| 59 | Pashupati Shiksha Mandir | 5 | 20 | 22 | 42 | 22 | 55 | 77 | 11 | 13 | 24 | 0 | 0 | 0 | 0 | 0 | 0 |
| 60 | Parbat Memorial High School | 10 | 0 | 0 | 0 | 69 | 154 | 223 | 31 | 58 | 89 | 19 | 28 | 47 | 9 | 24 | 33 |
| 61 | Ram Gopal English Memorial School | 17 | 36 | 91 | 127 | 39 | 77 | 116 | 23 | 22 | 45 | 0 | 0 | 0 | 0 | 0 | 0 |
| 62 | Red Hill Academy Basic School | 10 | 17 | 58 | 75 | 66 | 106 | 172 | 6 | 13 | 19 | 0 | 0 | 0 | 0 | 0 | 0 |
| 63 | Sagarmatha English Boarding School Karkado | 18 | 25 | 29 | 54 | 88 | 120 | 208 | 85 | 88 | 173 | 34 | 42 | 76 | 58 | 96 | 154 |
| 64 | St. Umer Public Basic School | 3 | 22 | 38 | 60 | 52 | 68 | 120 | 0 | 0 | 0 | 0 | 0 | 0 | 0 | 0 | 0 |
| 65 | Samabeshi English Boarding School Buspark | 4 | 70 | 75 | 145 | 72 | 73 | 145 | 30 | 22 | 52 | 19 | 21 | 40 | 0 | 0 | 0 |
| 66 | Sanskar Vidya Niketan | 17 | 28 | 40 | 68 | 53 | 74 | 127 | 0 | 0 | 0 | 0 | 0 | 0 | 0 | 0 | 0 |
| 67 | Sandipan Vidya Niketan | 18 | 39 | 62 | 101 | 40 | 66 | 106 | 5 | 4 | 9 | 0 | 0 | 0 | 0 | 0 | 0 |
| 68 | Shanti Vidya Niketan Banke | 1 | 136 | 180 | 316 | 113 | 152 | 265 | 43 | 55 | 98 | 21 | 25 | 46 | 0 | 0 | 0 |
| 69 | Shining Future Academy | 5 | 48 | 118 | 166 | 141 | 323 | 464 | 15 | 26 | 41 | 0 | 0 | 0 | 0 | 0 | 0 |
| 70 | Shree Buddha English Medium Secondary School | 4 | 18 | 29 | 47 | 42 | 61 | 103 | 28 | 32 | 60 | 22 | 17 | 39 | 0 | 0 | 0 |
| 71 | Shree Pashupati English Medium Boarding School | 14 | 29 | 37 | 66 | 82 | 166 | 248 | 11 | 31 | 42 | 0 | 0 | 0 | 0 | 0 | 0 |
| 72 | Shree Shaileshwari Vidya Niketan School | 10 | 47 | 83 | 130 | 76 | 110 | 186 | 28 | 47 | 75 | 14 | 23 | 37 | 0 | 0 | 0 |
| 73 | Sirichandra Mewalal Secondary School | 7 | 0 | 10 | 10 | 47 | 56 | 103 | 8 | 4 | 12 | 14 | 11 | 25 | 1 | 0 | 1 |
| 74 | Siddharth Vidya Sadan | 6 | 26 | 47 | 73 | 124 | 193 | 317 | 69 | 70 | 139 | 43 | 43 | 86 | 25 | 33 | 58 |
| 75 | Sophia R.I. English School | 10 | 51 | 99 | 150 | 206 | 236 | 442 | 57 | 82 | 139 | 23 | 29 | 52 | 17 | 12 | 29 |
| 76 | Spring Dale | 14 | 0 | 0 | 0 | 92 | 110 | 202 | 50 | 72 | 122 | 25 | 41 | 66 | 26 | 61 | 87 |
| 77 | St. Thomas English Boarding School | 1 | 19 | 20 | 39 | 78 | 91 | 169 | 29 | 55 | 84 | 23 | 32 | 55 | 23 | 38 | 61 |
| 78 | Star Future Secondary School | 1 | 17 | 36 | 53 | 115 | 180 | 295 | 41 | 61 | 102 | 24 | 40 | 64 | 0 | 0 | 0 |
| 79 | Star Light Academy School | 1 | 16 | 24 | 40 | 20 | 39 | 59 | 3 | 5 | 8 | 0 | 0 | 0 | 0 | 0 | 0 |
| 80 | Success English Medium Basic School | 20 | 24 | 42 | 66 | 38 | 68 | 106 | 10 | 20 | 30 | 0 | 0 | 0 | 0 | 0 | 0 |
| 81 | Sunbeam English Boarding School | 1 | 41 | 65 | 106 | 80 | 113 | 193 | 43 | 57 | 100 | 30 | 33 | 63 | 33 | 60 | 93 |
| 82 | United Educational Academy | 12 | 98 | 165 | 263 | 184 | 236 | 420 | 88 | 126 | 214 | 59 | 69 | 128 | 145 | 226 | 371 |
| 83 | Ost Zone English Boarding School | 13 | 60 | 109 | 169 | 148 | 240 | 388 | 63 | 90 | 153 | 41 | 46 | 87 | 0 | 0 | 0 |
| Total | 3,547 | 5,336 | 8,883 | 6,713 | 10,108 | 16,821 | 2,566 | 3,686 | 6,252 | 1,318 | 1,833 | 3,151 | 1,781 | 2,299 | 4,080 |
C) Religious Schools and Students Detail
| S.N. | School Name | Ward No. | CDC (Girls) | CDC (Boys) | CDC (Total) | Class 1-5 (Girls) | Class 1-5 (Boys) | Class 1-5 (Total) | Class 6-8 (Girls) | Class 6-8 (Boys) | Class 6-8 (Total) | Class 9-10 (Girls) | Class 9-10 (Boys) | Class 9-10 (Total) | Class 11-12 (Girls) | Class 11-12 (Boys) | Class 11-12 (Total) |
|---|---|---|---|---|---|---|---|---|---|---|---|---|---|---|---|---|---|
| 1 | Adara Miswahiya Gulsan Danis Madrasa | 6 | 0 | 0 | 0 | 40 | 66 | 106 | 6 | 4 | 10 | 0 | 0 | 0 | 0 | 0 | 0 |
| 2 | Ayusha Madrastul Banet Secondary School | 4 | 201 | 0 | 201 | 254 | 0 | 254 | 81 | 0 | 81 | 38 | 0 | 38 | 0 | 0 | 0 |
| 3 | Aljayatul Islamia Rajul Uloom Madrasa | 22 | 23 | 11 | 34 | 107 | 76 | 183 | 0 | 0 | 0 | 0 | 0 | 0 | 0 | 0 | 0 |
| 4 | Darul Uloom Gulsan Raja | 22 | 0 | 0 | 0 | 107 | 62 | 169 | 0 | 0 | 0 | 0 | 0 | 0 | 0 | 0 | 0 |
| 5 | Darul Uloom Badiudhiniyan Gulsan Ibrahim | 6 | 0 | 0 | 0 | 66 | 26 | 92 | 0 | 0 | 0 | 0 | 0 | 0 | 0 | 0 | 0 |
| 6 | Darul Uloom Mainiya Faizan Gazi | 16 | 0 | 0 | 0 | 78 | 36 | 114 | 0 | 0 | 0 | 0 | 0 | 0 | 0 | 0 | 0 |
| 7 | Darul Uloom Atai Mustaf Mohanpur | 23 | 0 | 0 | 0 | 64 | 40 | 104 | 0 | 0 | 0 | 0 | 0 | 0 | 0 | 0 | 0 |
| 8 | Darul Uloom Gulsan Madina Madrasa | 4 | 0 | 0 | 0 | 105 | 99 | 204 | 0 | 0 | 0 | 0 | 0 | 0 | 0 | 0 | 0 |
| 9 | Gulsan Basiya Talimul Quran Idgah | 23 | 0 | 0 | 0 | 118 | 84 | 202 | 0 | 0 | 0 | 0 | 0 | 0 | 0 | 0 | 0 |
| 10 | Jamia Arabia Mifatul Ulom | 3 | 19 | 46 | 65 | 75 | 131 | 206 | 9 | 9 | 18 | 0 | 0 | 0 | 0 | 0 | 0 |
| 11 | Jamia Islamia Raja E Mustaf Madrasa | 19 | 0 | 0 | 0 | 95 | 50 | 145 | 0 | 0 | 0 | 0 | 0 | 0 | 0 | 0 | 0 |
| 12 | Jamia Moniya Wadarul Uloom Madrasa | 22 | 0 | 0 | 0 | 73 | 43 | 116 | 0 | 0 | 0 | 0 | 0 | 0 | 0 | 0 | 0 |
| 13 | Madrasa Jamia Kadariya Jiyal Quran | 20 | 0 | 0 | 0 | 87 | 50 | 137 | 0 | 0 | 0 | 0 | 0 | 0 | 0 | 0 | 0 |
| 14 | Madrasa Jamia Arafiya Branisayul Uloom | 16 | 8 | 8 | 16 | 122 | 77 | 199 | 0 | 0 | 0 | 0 | 0 | 0 | 0 | 0 | 0 |
| 15 | Madrasa Darul Uloom Barkatiya | 11 | 39 | 65 | 104 | 231 | 270 | 501 | 147 | 163 | 310 | 37 | 16 | 53 | 0 | 0 | 0 |
| 16 | Madrasa Darul Uloom Juma Garib Nawaj | 16 | 11 | 14 | 25 | 127 | 66 | 193 | 0 | 0 | 0 | 0 | 0 | 0 | 0 | 0 | 0 |
| 17 | Madrasa Alpha Koriyanpur | 16 | 0 | 0 | 0 | 40 | 32 | 72 | 0 | 0 | 0 | 0 | 0 | 0 | 0 | 0 | 0 |
| 18 | Madrasa Amaniyal Banet | 4 | 0 | 0 | 0 | 81 | 0 | 81 | 0 | 0 | 0 | 0 | 0 | 0 | 0 | 0 | 0 |
| 19 | Madrasa Arbiya Jamiyul Hasanet | 16 | 29 | 16 | 45 | 123 | 62 | 185 | 0 | 0 | 0 | 0 | 0 | 0 | 0 | 0 | 0 |
| 20 | Madrasa Chistiya Garib Nawaj | 20 | 0 | 0 | 0 | 98 | 79 | 177 | 0 | 0 | 0 | 0 | 0 | 0 | 0 | 0 | 0 |
| 21 | Madrasa Chistiya Miswaiya Tamsasari | 15 | 45 | 23 | 68 | 98 | 52 | 150 | 0 | 0 | 0 | 0 | 0 | 0 | 0 | 0 | 0 |
| 22 | Madrasa Darul Uloom Arfiya | 6 | 4 | 8 | 12 | 63 | 96 | 159 | 0 | 0 | 0 | 0 | 0 | 0 | 0 | 0 | 0 |
| 23 | Madrasa Darul Uloom Garib Nawaj | 16 | 33 | 25 | 58 | 70 | 41 | 111 | 0 | 0 | 0 | 0 | 0 | 0 | 0 | 0 | 0 |
| 24 | Madrasa Gajiya Aravarlum | 22 | 0 | 0 | 0 | 48 | 24 | 72 | 0 | 0 | 0 | 0 | 0 | 0 | 0 | 0 | 0 |
| 25 | Madrasa Gulsangaji | 14 | 0 | 0 | 0 | 48 | 46 | 94 | 0 | 0 | 0 | 0 | 0 | 0 | 0 | 0 | 0 |
| 26 | Madrasa Hussain Gajiwal Uloom | 1 | 0 | 0 | 0 | 49 | 45 | 94 | 0 | 0 | 0 | 0 | 0 | 0 | 0 | 0 | 0 |
| 27 | Madrasa Islamia Faizul Uloom | 8 | 0 | 0 | 0 | 55 | 43 | 98 | 0 | 0 | 0 | 0 | 0 | 0 | 0 | 0 | 0 |
| 28 | Madrasa Jamia Misoiya Chistia Rahmatul Alam | 15 | 17 | 8 | 25 | 80 | 45 | 125 | 0 | 0 | 0 | 0 | 0 | 0 | 0 | 0 | 0 |
| 29 | Madrasa Jamia Habibiya Darul Raja Karkando | 18 | 0 | 0 | 0 | 7 | 15 | 22 | 0 | 0 | 0 | 0 | 0 | 0 | 0 | 0 | 0 |
| 30 | Madrasa Kadariya Gulsan Raja Jagarpur | 23 | 18 | 7 | 25 | 72 | 36 | 108 | 0 | 0 | 0 | 0 | 0 | 0 | 0 | 0 | 0 |
| 31 | Madrasa Maksudia | 13 | 18 | 7 | 25 | 86 | 72 | 158 | 0 | 0 | 0 | 0 | 0 | 0 | 0 | 0 | 0 |
| 32 | Madrasa Nurani Islamia | 15 | 51 | 19 | 70 | 102 | 49 | 151 | 0 | 0 | 0 | 0 | 0 | 0 | 0 | 0 | 0 |
| 33 | Madrasa Etimkhan Kadaria Akbural Aaloom | 21 | 0 | 0 | 0 | 78 | 48 | 126 | 0 | 0 | 0 | 0 | 0 | 0 | 0 | 0 | 0 |
| 34 | Aatimakhan Darul Aaloom Faizan Muftia Azam Chaulika | 10 | 0 | 0 | 0 | 89 | 36 | 125 | 0 | 0 | 0 | 0 | 0 | 0 | 0 | 0 | 0 |
| Total | 516 | 257 | 773 | 3,036 | 1,997 | 5,033 | 243 | 176 | 419 | 75 | 16 | 91 | 0 | 0 | 0 |
5.1.3 Teachers and Educational Manpower
Table No. 66: Details of Teachers and Educational Manpower in Sub-Metropolitan City
| S.N. | School Name | Operating Grades | Primary (Darbandi) | Primary (Rahat) | Primary (Total) | Lower Sec. (Darbandi) | Lower Sec. (Rahat) | Lower Sec. (Total) | Secondary (Darbandi) | Secondary (Rahat) | Secondary (Total) | Higher Sec. (Darbandi) | Higher Sec. (Rahat) | Higher Sec. (Total) | Grand Total |
|---|---|---|---|---|---|---|---|---|---|---|---|---|---|---|---|
| 1 | Saraswati Ma.Vi. | 12 | 7 | 0 | 7 | 4 | 0 | 4 | 5 | 0 | 5 | 0 | 2 | 2 | 18 |
| 2 | Gyansagar Ma.Vi. | 10 | 8 | 0 | 8 | 3 | 1 | 4 | 2 | 2 | 4 | 0 | 0 | 0 | 16 |
| 3 | Mahendra Ma.Vi. | 12 | 6 | 1 | 7 | 4 | 0 | 4 | 5 | 0 | 5 | 2 | 1 | 3 | 19 |
| 4 | Anathalaya Gousiya Ma.Vi. | 10 | 0 | 4 | 4 | 0 | 2 | 2 | 0 | 1 | 1 | 0 | 0 | 0 | 7 |
| 5 | Adarsha Ma.Vi. | 12 | 6 | 3 | 9 | 4 | 0 | 4 | 4 | 1 | 5 | 0 | 2 | 2 | 20 |
| 6 | Yuddha Sanskriti Ma.Vi. | 10 | 3 | 0 | 3 | 3 | 1 | 4 | 5 | 0 | 5 | 0 | 0 | 0 | 12 |
| 7 | Narayan Ma.Vi. | 12 | 6 | 0 | 6 | 4 | 0 | 4 | 5 | 0 | 5 | 0 | 2 | 2 | 17 |
| 8 | Maharaja Ma.Vi. | 12 | 7 | 1 | 8 | 4 | 0 | 4 | 5 | 0 | 5 | 0 | 0 | 0 | 17 |
| 9 | Shree Devtadin Ma.Vi. | 10 | 7 | 2 | 9 | 4 | 0 | 4 | 0 | 0 | 0 | 0 | 0 | 0 | 13 |
| 10 | Jaya Janata Ma.Vi. | 12 | 4 | 4 | 8 | 0 | 4 | 4 | 1 | 1 | 2 | 0 | 1 | 1 | 15 |
| 11 | Mangal Prasad Ma.Vi. | 12 | 7 | 2 | 9 | 4 | 0 | 4 | 4 | 1 | 5 | 4 | 0 | 4 | 22 |
| 12 | Ma.Vi. Mahendranagar | 10 | 5 | 1 | 6 | 3 | 0 | 3 | 1 | 2 | 3 | 0 | 0 | 0 | 12 |
| 13 | Jagat Jyoti Ma.Vi. | 10 | 4 | 3 | 7 | 1 | 3 | 4 | 1 | 1 | 2 | 0 | 0 | 0 | 13 |
| 14 | Dhambojhi Ma.Vi. | 12 | 12 | 1 | 13 | 4 | 0 | 4 | 4 | 0 | 4 | 4 | 0 | 4 | 25 |
| 15 | Phulteka Ma.Vi. | 10 | 5 | 1 | 6 | 4 | 0 | 4 | 3 | 1 | 4 | 0 | 0 | 0 | 14 |
| 16 | Nepalgunj Kanya Ma.Vi | 12 | 6 | 2 | 8 | 3 | 0 | 3 | 1 | 1 | 2 | 0 | 0 | 0 | 13 |
| 17 | Sharada Aadhabhut Vi. | 8 | 5 | 0 | 5 | 3 | 0 | 3 | 0 | 0 | 0 | 0 | 0 | 0 | 8 |
| 18 | Arun Jyoti Ma.Vi. | 7 | 4 | 3 | 7 | 0 | 0 | 0 | 0 | 0 | 0 | 0 | 0 | 0 | 11 |
| 19 | Ne.Ra. Aadhabhut Natanpur | 8 | 4 | 3 | 7 | 1 | 0 | 1 | 0 | 0 | 0 | 0 | 0 | 0 | 8 |
| 20 | Aa.Vi. Jayaspur | 8 | 3 | 4 | 7 | 0 | 2 | 2 | 0 | 0 | 0 | 0 | 0 | 0 | 9 |
| 21 | Bageshwari Aadhabhut Belaspur | 8 | 7 | 0 | 7 | 0 | 0 | 0 | 0 | 0 | 0 | 0 | 0 | 0 | 7 |
| 22 | Hanuman Aa.Vi. Jamunaha | 8 | 5 | 0 | 5 | 3 | 1 | 4 | 0 | 0 | 0 | 0 | 0 | 0 | 9 |
| 23 | Ne.Ra.Pra.Vi. Suiya | 5 | 4 | 1 | 5 | 0 | 0 | 0 | 0 | 0 | 0 | 0 | 0 | 0 | 5 |
| 24 | Aadhabhut Vidyalaya Puraini | 8 | 6 | 1 | 7 | 1 | 1 | 2 | 0 | 0 | 0 | 0 | 0 | 0 | 9 |
| 25 | Ne.Ra.Ma.Vi. Gharbaritol | 9 | 7 | 0 | 7 | 2 | 0 | 2 | 0 | 0 | 0 | 0 | 0 | 0 | 9 |
| 26 | Ne.Ra.Ma.Vi. Kanthipur | 8 | 5 | 2 | 7 | 2 | 0 | 2 | 0 | 0 | 0 | 0 | 0 | 0 | 9 |
| 27 | Hanuman Pra.Vi. Gosaigaun | 5 | 4 | 1 | 5 | 0 | 0 | 0 | 0 | 0 | 0 | 0 | 0 | 0 | 5 |
| 28 | Ramjanaki Pra.Vi. Lagdahawa | 3 | 2 | 0 | 2 | 0 | 0 | 0 | 0 | 0 | 0 | 0 | 0 | 0 | 2 |
| 29 | Ramjanaki Ra.Pra.Vi. Manikapur | 3 | 1 | 1 | 2 | 0 | 0 | 0 | 0 | 0 | 0 | 0 | 0 | 0 | 2 |
| 30 | Karnababa Pra.Vi. | 5 | 2 | 2 | 4 | 0 | 0 | 0 | 0 | 0 | 0 | 0 | 0 | 0 | 4 |
| 31 | Shree Lalabhuwaneshwari Suryapur | 5 | 4 | 0 | 4 | 0 | 0 | 0 | 0 | 0 | 0 | 0 | 0 | 0 | 4 |
| 32 | Bhawani Ne.Pra.Vi. Madanapur | 3 | 3 | 0 | 3 | 0 | 0 | 0 | 0 | 0 | 0 | 0 | 0 | 0 | 3 |
| 33 | Saraswati Pra.Vi. Nepalgunj | 3 | 2 | 2 | 4 | 0 | 0 | 0 | 0 | 0 | 0 | 0 | 0 | 0 | 4 |
| 34 | Ne.Ra.Pra.Vi. Kalbapurwa | 5 | 5 | 0 | 5 | 0 | 0 | 0 | 0 | 0 | 0 | 0 | 0 | 0 | 5 |
| 35 | Balmandir Pra.Vi. Nepalgunj | 5 | 4 | 0 | 4 | 0 | 0 | 0 | 0 | 0 | 0 | 0 | 0 | 0 | 4 |
| 36 | Karagar Pra.Vi. Nepalgunj | 5 | 1 | 0 | 1 | 0 | 0 | 0 | 0 | 0 | 0 | 0 | 0 | 0 | 1 |
| 37 | Balmiki Pra.Vi. Koriyanpur | 3 | 3 | 0 | 3 | 0 | 0 | 0 | 0 | 0 | 0 | 0 | 0 | 0 | 3 |
| 38 | Pateshwari Aa.Vi. Bhujangaun | 8 | 4 | 1 | 5 | 0 | 0 | 0 | 0 | 0 | 0 | 0 | 0 | 0 | 5 |
| 39 | Ne.Ra.Pra.Vi. Sangamnagar | 5 | 1 | 2 | 3 | 0 | 0 | 0 | 0 | 0 | 0 | 0 | 0 | 0 | 3 |
| 40 | Ne.Ra.Pra.Vi. Fingariyanpurwa | 5 | 2 | 3 | 5 | 0 | 0 | 0 | 0 | 0 | 0 | 0 | 0 | 0 | 5 |
| 41 | Ne.Ra.Pra.Vi. Jangalisinhapurwa | 5 | 3 | 1 | 4 | 0 | 0 | 0 | 0 | 0 | 0 | 0 | 0 | 0 | 4 |
| 42 | Ne.Ra.Pra.Vi. Bageshwaritol | 3 | 3 | 0 | 3 | 0 | 0 | 0 | 0 | 0 | 0 | 0 | 0 | 0 | 3 |
| Total | 187 | 52 | 239 | 61 | 15 | 76 | 46 | 11 | 57 | 10 | 8 | 18 | 390 |
Table No. 67: Details of Religious School Teacher Grant Quota in Sub-Metropolitan City
| S.N. | School Name | Primary (Darbandi) | Primary (Rahat) | Primary (Total) |
|---|---|---|---|---|
| 1 | Jamia Kadariya Jiyaun Karan | 0 | 1 | 1 |
| 2 | Madrasa Gajiya Anwarul Alum | 0 | 1 | 1 |
| 3 | Aidara Miswahiya Gulshane Danish | 0 | 3 | 3 |
| 4 | Madrasa Masyudiya Aale Mustafa | 0 | 1 | 1 |
| 5 | Jamia Mainiya Badarul Uloom | 0 | 2 | 2 |
| 6 | Aljayitul Islamia Razaul Uloom | 0 | 1 | 1 |
| 7 | Jamia Islamia Razae Mustafa | 0 | 2 | 2 |
| 8 | Madrasa Arbiya Jamiul Hasnat | 0 | 1 | 1 |
| 9 | Darul Uloom Moinia Faizane Gaji | 0 | 1 | 1 |
| 10 | Aaisa Madrasa Tul Wanat | 0 | 5 | 5 |
| 11 | Madrasa Darul Uloom Faizul Rasul | 0 | 1 | 1 |
| 12 | Madrasa Darul Uloom Garib Nawaz | 0 | 1 | 1 |
| 13 | Madrasa Gulshane Gaji | 0 | 1 | 1 |
| 14 | Barkatiya Ma.Vi. | 0 | 3 | 3 |
| 15 | Madrasa Miswahiya Chistiya | 0 | 1 | 1 |
| Total | 0 | 25 | 25 |
5.1.4 Schools with ICT Lab
| S.N. | School Name | Address |
|---|---|---|
| 1. | Shree Phulteka Ma.Vi. | Nepalgunj-6 |
| 2. | Shree Anathalaya Ma.Vi. | Nepalgunj-4 |
| 3. | Shree Jaya Janata Ma.Vi. | Nepalgunj-20, Dhapuwa |
5.1.5 Schools with Library Facilities
| School Name | Address | Number |
|---|---|---|
| Shree Mangalprasad Ma.Vi. (Model School) | Nepalgunj-8 | 1 |
| Shree Pateshwari Aa.Vi. (Library) | Nepalgunj-18 Bhujingaun | 1 |
5.1.6 Educational Quality Details
School Support Mechanism
Exam Management
Teachers Capacity Development Training
Regular Monitoring and Supervision
Act, Regulation and Procedure Formulation
5.1.7 Child-Friendly Education Details
Currently, efforts made by Nepalgunj Sub-Metropolitan City regarding child-friendly education are as follows:
Punishment-free Education
Arrangement of Play Materials in Child Development
Arrangement of Capacity Development Training
Arrangement of Child-Friendly Drinking Water and Toilets
Formation of Child Clubs
Operation of Programs Related to Child Education
5.2 Health and Nutrition
5.2.1 Health Institutions Details
Bheri Hospital
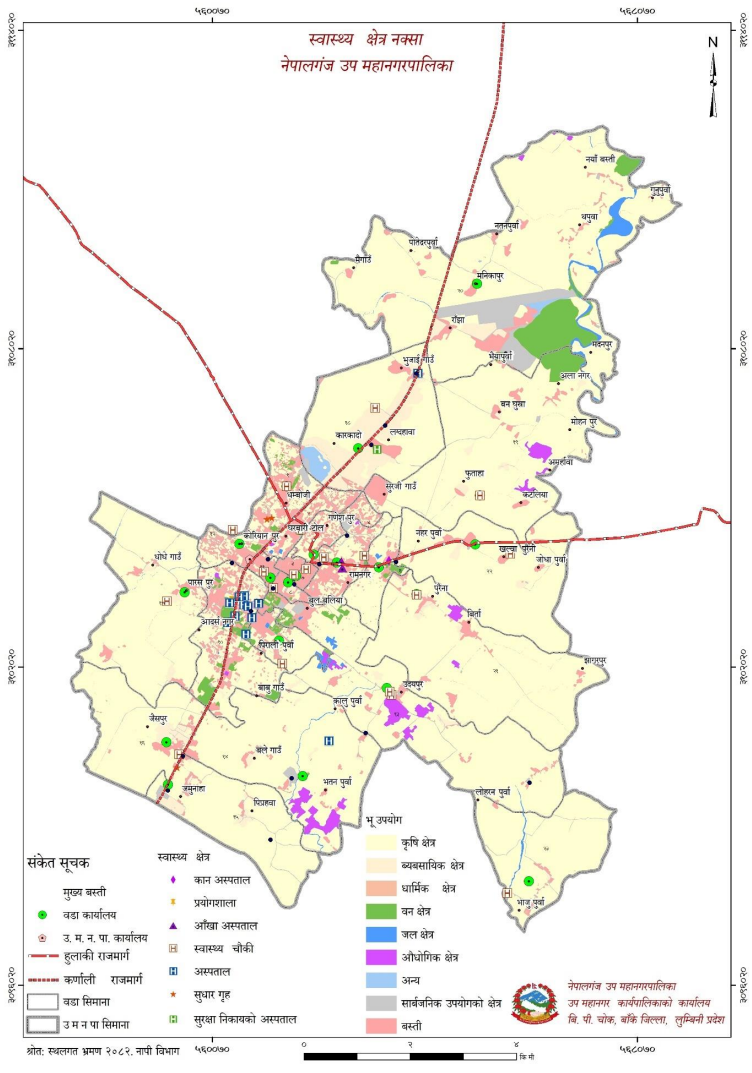
Map No. 8: Health Map of Sub-Metropolitan City
Article 35 of the Constitution of Nepal has established the right relating to health as a fundamental right. Sub-article 1 mentions that every citizen shall have the right to free basic health services from the State, and no one shall be deprived of emergency health services. As it is the responsibility of the local government to implement this right, it is essential to manage basic health infrastructure and services in the Sub-Metropolitan City.
Due to the accessible geographical condition of this Sub-Metropolitan City, the condition of essential physical and social infrastructure is good. Education, health, poverty, and other indicators appear relatively stronger compared to other local levels of the country. Currently, health services are being provided in the Sub-Metropolitan City through the private sector including Bheri Hospital, Nepalgunj Medical College, along with 12 Urban Health Centers and 11 Health Posts under the Nepalgunj Sub-Metropolitan City. Natural naturopathy centers and Ayurveda centers are also in operation from the private sector.
Table No. 68: Details of Health Institutions in the Sub-Metropolitan City
| S.N. | Details of Health Institution | Address |
|---|---|---|
| 1. | Urban Health Service Center | Ward No. 1 |
| 2. | Urban Health Service Center | Ward No. 2 |
| 3. | Urban Health Service Center | Ward No. 3 |
| 4. | Urban Health Service Center | Ward No. 4 |
| 5. | Urban Health Service Center | Ward No. 5 |
| 6. | Urban Health Service Center | Ward No. 6 |
| 7. | Urban Health Service Center | Ward No. 7 |
| 8. | Urban Health Service Center | Ward No. 8 |
| 9. | Urban Health Service Center | Ward No. 9 |
| 10. | Urban Health Service Center | Ward No. 10 |
| 11. | Urban Health Service Center | Ward No. 11 |
| 12. | Nepalgunj Health Post | Ward No. 12 |
| 13. | Udayapur Health Post | Ward No. 13 |
| 14. | Bhawaniyapur Health Post | Ward No. 14 |
| 15. | Piprahwa Health Post | Ward No. 15 |
| 16. | Jayaspur Health Post | Ward No. 16 |
| 17. | Paraspur Health Post | Ward No. 17 |
| 18. | Khaskarkando Health Post | Ward No. 18 |
| 19. | Basudevpur Health Post | Ward No. 19 |
| 20. | Manikapur Health Post | Ward No. 20 |
| 21. | Puraina Health Post | Ward No. 21 |
| 22. | Puraini Health Post | Ward No. 22 |
| 23. | Urban Health Service Center | Ward No. 23 |
| 24. | Bheri Hospital | |
| 25. | Specialist Children's Hospital Nepalgunj | |
| 26. | Sanjivani Diagnosis Center Nepalgunj | |
| 27. | Western Hospital Nepalgunj | |
| 28. | Nepalgunj Medical College Nepalgunj | |
| 29. | Kanti Arogya Hospital Nepalgunj | |
| 30. | Nepal Health Campus | |
| 31. | I.N.F. Hospital Manpur | |
| 32. | Sungabha Health | |
| 33. | Everest Health Care |
5.2.2 Immunization and Safe Motherhood
A) Details of Immunization
Children are the builders of the future. For this, it is necessary for them to be healthy and disease-free. In childhood, they must be given BCG once, DPT three times, Measles once, Polio, and Vitamins in prescribed doses. All five vaccines should be given to children regularly and in full doses. The Government of Nepal has placed the National Immunization Program as a high priority. The immunization program is an effective and economical effort in the health sector. The immunization program has significantly helped to reduce the child mortality rate and prevent various diseases. This has helped to achieve the Sustainable Development Goal's target of reducing child mortality (MDG-4).
Table No. 69: Details regarding Immunization
| S.N. | Indicators | Shrawan 2079 / Asar 80 | Shrawan 2080 / Asar 81 | Shrawan 2081 / Asar 82 |
|---|---|---|---|---|
| 1 | Overall monthly reporting rate of Sub-Metropolitan City (%) | 100 | 100 | 100 |
| 2 | Overall monthly reporting rate on time of Sub-Metropolitan City (%) | 90.18 | 91.95 | 83.33 |
| 3 | % of children receiving full immunization as per national immunization schedule | 82.93 | 101.32 | 106.79 |
| 4 | % of children taking BCG vaccination under 1 year | 170.65 | 166.93 | 153.02 |
| 5 | % of children taking DPT first vaccination under 1 year | 123.42 | 121.71 | 112.71 |
| 6 | % of children taking DPT third vaccination under 1 year | 115.15 | 116.03 | 106.34 |
| 7 | % of children under 1 year receiving first dose of Measles-Rubella vaccine | 110.91 | 110.89 | 103.94 |
| 8 | % of children between 12 to 23 months receiving second dose of Measles-Rubella vaccine | 109.22 | 104.5 | 111.85 |
| 9 | % of pregnant women receiving TD2 & TD2+ vaccination | 99.8 | 99.47 | 91.07 |
| 10 | % of children taking PCV first vaccination under 1 year | 124.48 | 121.71 | 112.4 |
| 11 | % of children taking PCV third vaccination under 1 year | 112.89 | 110.86 | 104.13 |
| 12 | Penta 1 Vs Measles 2 Drop out rate | 11.19 | 15.62 | 4.9 |
| 13 | Penta 1 Vs Penta 3 Drop out rate | 6.7 | 4.67 | 5.65 |
| 14 | PCV Drop out rate | 9.31 | 8.92 | 7.36 |
| 15 | Measles vaccine Drop out rate | 15.07 | 17.17 | 16.96 |
| 16 | Measles vaccine wastage rate | 38.1 | 41.19 | 37.05 |
| 17 | TD vaccine wastage rate | 23.74 | 25.08 | 27.36 |
| 18 | % of low weight children among those whose growth was monitored (0-23 months) | 75.22 | 67.54 | 58.84 |
| 19 | % of infants with low birth weight (2.5kg) in health institutions | 14.41 | 14.13 | 15.07 |
| 20 | Average growth monitoring times for children 0-23 months | 4.46 | 5.89 | 5.62 |
| 21 | % of PSBI among registered sick patients under 2 months | 7.25 | 5.03 | 0.54 |
| 22 | % of children with PSBI receiving first dose of Gentamicin | 80 | 100 | 100 |
| 23 | % of children with PSBI receiving full dose of Gentamicin | 40 | 100 | 50 |
| 24 | Incidence rate of diarrhea among children under five years (per thousand) | 399.89 | 736.14 | 554.26 |
| 25 | Incidence rate of acute respiratory infection (ARI) among children under five years (per thousand) | 506.52 | 773.11 | 736.75 |
| 26 | Incidence rate of pneumonia among children under five years (per thousand) | 84.62 | 99.39 | 68.93 |
| 27 | Incidence rate of pneumonia among children under five years suffering from ARI (per thousand) | 100.87 | 100 | 100 |
| 28 | Percentage of infants aged 2 to 59 months with pneumonia treated with Antibiotics (Amoxicillin) | 375 | 117.32 | 233.33 |
| 29 | % of women undergoing pregnancy check-up at least once in health institutions | 156.82 | 152.18 | 132.16 |
| 30 | % of women undergoing first pregnancy check-up as per protocol in health institutions | 59.1 | 53.66 | 53.44 |
| 31 | % of women undergoing pregnancy check-up four times as per protocol in health institutions | 66.17 | 51.15 | 65.48 |
| 32 | % of women receiving 180 Iron tablets during pregnancy | 66.03 | 51.73 | 59.41 |
| 33 | % of women receiving Calcium tablets during pregnancy | 4.73 | 11.3 | 19.08 |
| 34 | % of women undergoing pregnancy check-up eight times as per protocol in health institutions | 13.36 | 26.93 | 29.57 |
| 35 | Institutional delivery % | 333.57 | 321.99 | 282.46 |
| 36 | Delivery % under 20 years | 6.13 | 5.92 | 5.82 |
| 37 | % of postpartum women receiving Iron tablets for 45 days | 16.51 | 102.27 | 101.87 |
| 38 | Number of postpartum women receiving Iron tablets for 45 days | 1528 | 9628 | 8813 |
| 39 | Number of postpartum women receiving Vitamin A | 6956 | 9616 | 8704 |
| 40 | Total Malaria positive cases | 10 | 12 | 40 |
| 41 | Leprosy prevalence rate per 10,000 population | 6.74 | 12.03 | 11.88 |
| 42 | Leprosy new case detection rate (per 10,000) | 0.7 | 1.17 | 0.82 |
| 43 | Number of new leprosy patients | 12 | 20 | 14 |
| 44 | Case notification rate (CNR) for all types of TB cases | 189.33 | 183.64 | 174.07 |
| 45 | Tuberculosis treatment success rate | 91.84 | 88.81 | 88.63 |
| 46 | Number of newly registered tuberculosis patients | 303 | 287 | 281 |
| 47 | Number of registered relapse tuberculosis patients | 23 | 26 | 18 |
Vaccines against deadly diseases that can be contracted in childhood and later in life such as Tuberculosis, Diphtheria, Whooping Cough, Tetanus, Hepatitis B, Influenza type B, Polio, Pneumonia, Measles, Rubella and Japanese Encephalitis must be compulsorily administered in a phased manner on time. These vaccines are BCG, DPT, OPV, PCV, IPV, MR, JE / ID respectively. Thus, if vaccines are administered on time, it becomes an effective measure to control child mortality by being free from the risk of major diseases with limited investment.
B) Safe Motherhood Status Details
If children are not cared for and looked after from the time they are in the womb and after birth, they are at risk of being infected with various diseases. While in the womb, the child's health basically depends on the mother's age, nutrition, rest, intake of intoxicating and tobacco substances, etc. For a child to be born healthy, a pregnant woman must have regular health check-ups at least four times and must take the necessary vaccines (T.T.) and iron, vitamin tablets regularly. Since getting pregnant at a young age harms the health of both the mother and the baby, the government has legally set the minimum age for marriage at 20 years. However, 17 percent of teenage girls get pregnant or become mothers between the ages of 15 to 19 (Nepal Demographic and Health Survey, 2011). The government has been consistently conducting community-based programs for safe motherhood and newborn health through the Department of Health Services.
Table No. 70: Details of Safe Motherhood Status
| S.N. | Indicators | Shrawan 2078 to Asar 79 | Shrawan 2079 to Asar 80 | Shrawan 2080 to Chaitra End 81 |
|---|---|---|---|---|
| 1 | Number of women getting pregnancy check-ups 4 times as per protocol | 63 | 66 | 59 |
| 2 | Number of women getting pregnancy check-ups 8 times as per protocol | 0 | 13 | 27 |
| 3 | Total number of live birth newborns at home | 111 | 16 | 41 |
| 4 | Number of institutional deliveries | 320 | 334 | 322 |
| 5 | Delivery rate by Skilled Birth Attendant (SBA) | 315 | 77 | 69 |
| 6 | Delivery rate by Skilled Health Personnel (SHP) | 5 | 257 | 253 |
| 7 | Number of women getting pregnancy check-ups 3 times as per protocol | 88 | 44 | 40 |
| 8 | Total number of maternal deaths | 16 | 13 | 9 |
| 9 | Number of newborn deaths | 157 | 94 | 89 |
| Total | 1075 | 914 | 909 |
5.2.3 Child Health and Malnutrition
The state of nutrition of any place can be easily estimated by looking at the children of that place. Nourished children can be seen as an indicator of the social and economic development of any place. The government has prioritized nutrition and has been regularly monitoring the child growth of children under 5 years. The Convention on the Rights of the Child, 1989 also mentions that children should be protected from neglect, abandonment, negligence, abuse, and violence, and their right to food and nutrition should be ensured. The Constitution of Nepal (2072) has also placed food sovereignty as a fundamental right. Since health and nutrition are the first important needs of human life and without healthy citizens, other development activities of the nation cannot be effective, public health study becomes an important part of the planning process. In this Sub-Metropolitan City, while effectively monitoring the child nutrition allowance provided by the Government of Nepal based on national policy and programs to bring improvement in nutrition, arrangements have been made to improve the nutrition of children, along with running programs like the Multi-Sectoral Nutrition Plan taking lessons from the past to bring effective improvements in nutrition. Apart from this, national and international organizations are also working to carry out health and nutrition-related works.
Table No. 71: State of Child Health and Malnutrition
| S.N. | Indicators | Unit | Shrawan 2078 to Asar 79 | Shrawan 2079 to Asar 80 | Shrawan 2080 to Falgun End 81 |
|---|---|---|---|---|---|
| 1 | Low birth weight newborns | Percent | 4.2 | 3.7 | 1.5 |
| 2 | Average times weight taken of children completing 23 months in percentage | Percent | 70.8 | 75.2 | 67.5 |
| 3 | Babies breastfed for up to 6 months after birth | Percent | 37.5 | 41.2 | 68.2 |
| 4 | Number of pregnant women taking 180 Iron | Percent | 65 | 66 | 51.7 |
| 5 | Women receiving Vitamin A during postpartum stage | Percent | 74 | 75.2 | 102.1 |
| 6 | Average visits of under 2 years infants for growth monitoring | Percent | 3 | 3.7 | 4.1 |
| 7 | Number of severely malnourished children | Number | 0 | 121 | 140 |
| 8 | Severely malnourished children cured | Percent | 0 | 14.1 | 14.4 |
| 9 | % of children aged 6-23 months receiving 3 cycles (180 pieces) of Baalvita | Percent | 0 | 2.5 | 9.1 |
| Total | 250.3 | 486.9 | 537.1 |
5.2.4 Major Diseases and Treatment Details
According to the number of patients registered in the OPD of health institutions under this Sub-Metropolitan City, the details of the top 10 health problems seen recently are mentioned in the table below.
Table No. 72: Details of top 10 health problems
| S.N. | Indicators | Shrawan 2079 / Asar 80 | Shrawan 2080 / Asar 81 | Shrawan 2081 / Asar 82 |
|---|---|---|---|---|
| 1 | Eye problem (Cataract patients) | 18898 | 19914 | 19535 |
| 2 | Eye problem (Refractive patients) | 15819 | 17891 | 36319 |
| 3 | Eye problem (Conjunctivitis patients) | 14891 | 37654 | 12161 |
| 4 | Outpatient disease - ENT Infection - Chronic Suppurative Otitis Media patients | 10138 | 12088 | 12874 |
| 5 | Outpatient disease - Other infectious diseases - Upper Respiratory Tract Infection (URTI) patients | 9217 | 7813 | 7937 |
| 6 | OPD disease - Orthopedic - Fracture | 8749 | 8301 | 304 |
| 7 | Outpatient disease - Skin disease - Fungal infection (Lichen planus) patients | 8150 | 5622 | 4224 |
| 8 | OPD Morbidity - Other diseases and injuries - Headache | 6054 | 4414 | 4157 |
| 9 | Outpatient disease - Other Infectious diseases - ARI / Lower Respiratory Tract Infection (LRTI) patients | 5157 | 3318 | 3290 |
| 10 | OPD disease - General symptoms - Fever | 4618 | 5749 | 4146 |
5.2.5 Safe Motherhood
A) Family Planning
From studies done by various organizations indicating benefits of family planning, it has been proven that it plays a significant role in improving the health of mothers, children, and newborns. In addition, it helps to promote gender equality, women's education, and growth development. Therefore, with the aim of providing quality family planning services, the reproductive health program and family planning program have been expanded since 1991 to hospitals, health posts, primary health centers, and urban clinics, providing services through female health volunteers. Currently, the details of users of family planning devices within the Sub-Metropolitan City are included in the table below.
Table No. 73: Details of Family Planning Users
| S.N. | Indicators | Shrawan 2079 / Asar 80 | Shrawan 2080 / Asar 81 | Shrawan 2081 / Asar 82 |
|---|---|---|---|---|
| 1 | Number of continuous users of Pills | 1465 | 1526 | 771 |
| 2 | Number of continuous users of Depo | 1972 | 2001 | 1944 |
| 3 | Number of continuous users of IUCD | 997 | 1070 | 1102 |
| 4 | Number of continuous users of Implant | 1888 | 2077 | 2229 |
| Total | 6322 | 6674 | 6046 |
B) Details of born, living and died children based on sex of child and mother's age group
Table No. 74: Details of born, living and died children based on sex of child and mother's age group
| Sex/Status | 15-19 years | 20-24 years | 25-29 years | 30-34 years | 35-39 years | 40-44 years | 45-49 years | Total |
|---|---|---|---|---|---|---|---|---|
| Total born children number | ||||||||
| Boys | 203 | 2565 | 5832 | 7459 | 8810 | 7496 | 6168 | 38533 |
| Girls | 174 | 2263 | 5261 | 6999 | 7833 | 6389 | 5185 | 34104 |
| Total | 377 | 4828 | 11093 | 14458 | 16643 | 13885 | 11353 | 72637 |
| Children currently alive | ||||||||
| Boys | 199 | 2497 | 5702 | 7292 | 8587 | 7282 | 5952 | 37511 |
| Girls | 171 | 2207 | 5166 | 6845 | 7621 | 6223 | 4986 | 33219 |
| Total | 370 | 4704 | 10868 | 14137 | 16208 | 13505 | 10938 | 70730 |
| Deceased children | ||||||||
| Boys | 4 | 68 | 130 | 167 | 223 | 214 | 216 | 1022 |
| Girls | 3 | 56 | 95 | 154 | 212 | 166 | 199 | 885 |
| Total | 7 | 124 | 225 | 321 | 435 | 380 | 415 | 1907 |
Out of the total 72,637 children born alive in the last 12 months by women in the 15 to 49 age group in the Sub-Metropolitan City, 70,730 children are currently alive. Similarly, the number of children who died during the same period is 1,907, the detailed breakdown of which by sex is presented in the table.
C) Details of women's age at first childbirth
From legal and reproductive health perspectives, becoming a mother at the age of 20 or under is considered illegal and risky for the health of both mother and child. On one hand, physical, mental, and financially immature conception and childbirth carry a high risk of giving birth to an immature, low birth weight, physically and intellectually handicapped child, while on the hand, without adequate knowledge about antenatal care, maternal and child care, nutrition, and hygiene, there is a possibility that mother and child may fall victim to various types of infections. Nepal has achieved significant progress in the field of maternal and child health between the Millennium Development Goals 2000-2015. Taking 1990 as the base year, 108 out of every 1000 live births died in Nepal, and this number has substantially declined to 33 by 2015, while the under-5 child mortality rate (per thousand) has dropped to 38. Similarly, considering 1990 as the base year, maternal mortality (per hundred thousand) was 850, which appears to have dropped to 258 by 2015, while data shows the proportion of women receiving deliveries from trained health workers reached 55.6 percent. Overall, signs of positive impact in the area of maternal and child health are appearing in the municipality.
Table No. 75: Female population according to the number of children currently born alive by married women in the 15-49 age group
| Currently alive children | 15-19 years | 20-24 years | 25-29 years | 30-34 years | 35-39 years | 40-44 years | 45-49 years | Total married women |
|---|---|---|---|---|---|---|---|---|
| No child | 588 | 1724 | 1116 | 520 | 325 | 286 | 267 | 4806 |
| 1 child | 215 | 1968 | 2036 | 1361 | 834 | 488 | 375 | 7277 |
| 2 children | 60 | 919 | 2103 | 2337 | 2199 | 1643 | 1041 | 10302 |
| 3 children | 10 | 257 | 984 | 1342 | 1466 | 1130 | 883 | 6072 |
| 4 children | 3 | 52 | 335 | 628 | 826 | 692 | 548 | 3084 |
| 5 children | 0 | 5 | 87 | 212 | 389 | 393 | 341 | 1427 |
| 6 children | 0 | 3 | 16 | 90 | 174 | 185 | 185 | 652 |
| 7 children | 0 | 0 | 4 | 36 | 57 | 69 | 98 | 264 |
| 8 children | 0 | 0 | 0 | 3 | 35 | 34 | 46 | 118 |
| More than 9 children | 0 | 0 | 0 | 1 | 4 | 14 | 19 | 38 |
| Total | 876 | 4928 | 6681 | 6530 | 6309 | 4913 | 3803 | 34040 |
| Percentage | 2.57 | 14.48 | 19.63 | 19.18 | 18.53 | 14.43 | 11.17 | 100 |
Out of a total of 34,040 in the Sub-Metropolitan City, 876 women, i.e., 2.57 percent, appeared to have given birth to their first child between the ages of 15-19. Similarly, 4,928 or 14.48 percent of women became mothers at 20-24 years of age, 6,681 or 19.63 percent at 25-29 years, and 6,530 or 19.18 percent at 30-34 years of age, while the number of women becoming mothers for the first time above 35-39 years is 6,309, which is 18.53 percent. In the exact same way, there are 4,913 women or 14.43 percent for 40-44 years, and 3,803 or 11.17 percent of women aged 45-49 have given birth to their first child.
5.2.6 Married and Unmarried Women and Men Details
Table No. 76: Details of Married and Unmarried Women and Men
| S.N. | Details of Men and Women | Number of Men | Number of Women | Total | Percentage |
|---|---|---|---|---|---|
| 1. | Unmarried | 27,827 | 21,997 | 49,824 | 37.2 |
| 2. | Married | 37,222 | 40,666 | 77,888 | 58.2 |
| 3. | Single (Widower/Widow) | 1,259 | 4,137 | 5,396 | 4.0 |
| 4. | Divorced | 87 | 161 | 248 | 0.2 |
| 5. | Separated | 152 | 259 | 401 | 0.3 |
| Total | 66,537 | 67,220 | 1,33,757 | 100 |
5.3 Drinking Water and Sanitation
5.3.1 Drinking Water Source Details
Clean water and sanitation are major factors affecting human health and Sustainable Development Goal 6 aims to ensure safe drinking water and sanitation. Furthermore, the Constitution of Nepal has recognized drinking water and sanitation as fundamental rights of citizens. Therefore, to contribute towards producing healthy citizens, high priority should be given to constructing additional drinking water projects and scientific methods should be used for solid waste management.
Table No. 77: Details of households based on main source of drinking water
| Ward No. | Pipe tap (inside premises) | Pipe tap (outside premises) | Tube well/Hand pump | Covered well/kuwa | Uncovered open well/kuwa | Spring water tap | River/Stream | Jar/Bottle | Other | Total |
|---|---|---|---|---|---|---|---|---|---|---|
| 1 | 741 | 136 | 475 | 3 | 21 | 156 | 1 | 622 | 12 | 2167 |
| 2 | 334 | 228 | 288 | 1 | 0 | 1 | 0 | 465 | 46 | 1363 |
| 3 | 379 | 63 | 55 | 0 | 2 | 0 | 0 | 55 | 2 | 556 |
| 4 | 458 | 186 | 665 | 10 | 19 | 64 | 2 | 1387 | 127 | 2918 |
| 5 | 208 | 46 | 663 | 1 | 10 | 2 | 1 | 200 | 6 | 1137 |
| 6 | 238 | 8 | 767 | 0 | 2 | 2 | 0 | 385 | 9 | 1411 |
| 7 | 214 | 40 | 213 | 0 | 0 | 0 | 0 | 107 | 24 | 598 |
| 8 | 605 | 31 | 141 | 0 | 1 | 0 | 0 | 65 | 1 | 844 |
| 9 | 552 | 20 | 545 | 1 | 3 | 0 | 0 | 301 | 5 | 1427 |
| 10 | 517 | 141 | 1321 | 3 | 8 | 3 | 0 | 595 | 63 | 2651 |
| 11 | 696 | 242 | 36 | 0 | 1 | 2 | 0 | 22 | 2 | 1001 |
| 12 | 372 | 102 | 704 | 2 | 1 | 0 | 0 | 521 | 25 | 1727 |
| 13 | 743 | 220 | 378 | 0 | 4 | 10 | 0 | 110 | 1 | 1466 |
| 14 | 775 | 34 | 234 | 0 | 2 | 0 | 0 | 9 | 2 | 1056 |
| 15 | 353 | 32 | 321 | 2 | 1 | 376 | 0 | 4 | 45 | 1134 |
| 16 | 221 | 52 | 806 | 1 | 3 | 0 | 0 | 7 | 10 | 1100 |
| 17 | 844 | 81 | 166 | 0 | 2 | 68 | 0 | 43 | 8 | 1212 |
| 18 | 975 | 126 | 374 | 4 | 15 | 65 | 5 | 956 | 182 | 2702 |
| 19 | 642 | 556 | 369 | 7 | 1 | 0 | 0 | 136 | 0 | 1711 |
| 20 | 1243 | 401 | 1039 | 2 | 13 | 95 | 0 | 476 | 25 | 3294 |
| 21 | 771 | 313 | 446 | 1 | 3 | 0 | 0 | 11 | 8 | 1553 |
| 22 | 180 | 27 | 718 | 0 | 5 | 0 | 0 | 58 | 78 | 1066 |
| 23 | 36 | 5 | 294 | 0 | 0 | 0 | 0 | 0 | 0 | 335 |
| Total | 12091 | 3106 | 11112 | 38 | 125 | 844 | 9 | 6551 | 689 | 34565 |
| Percentage | 34.98 | 8.99 | 32.15 | 0.11 | 0.36 | 2.44 | 0.03 | 18.95 | 1.99 | 100 |
Out of 34,565 households residing in this Sub-Metropolitan City, generally the most number of families drink water from Pipe tap (inside premises) which is 12,091 or 34.98 percent. Similarly, the number of families drinking water from Pipe tap (outside premises) is 3,106 or 8.99 percent. Generally, 11,112 households or 32.15 percent drink water from Tube well/Hand pump. In addition, there are 6,551 or 18.95 percent households using Jar/bottles. Likewise, the number of households drinking spring tap water is 844 or 2.44 percent, river/stream water is 9 or 0.03 percent, those drinking water from uncovered open wells is 125 or 0.36 percent, while those drinking from covered wells is 38 or 0.11 percent, and families using other water sources is 689 or 1.99 percent. Its detailed breakdown by ward is presented in the table.
Details of households based on main source of drinking water
Tap bars or slices to view details
According to Sustainable Development Goals Status & Roadmap: 2016-2030 (SDG-6), taking 2015 as the base year, only 15 percent of the population is seen consuming safe drinking water. According to this document, which also includes the sustainable development goal monitoring framework, this population is expected to increase gradually. Accordingly, an ambitious target has been set to reach 35 percent in 2019, 50 percent in 2022, 65 percent in 2025, and 90 percent of the total population consuming safe drinking water by 2030. To support achieving the national target and to improve the public health of the general public, there is a need to spread widespread public awareness about checking the suitability of water and safety measures while using water.
5.3.2 Toilet Usage Status
Even now, in some remote town settlements, people defecate in water sources and open places. For a civilized society, this practice is a symbol of incivility. Defecation in open areas leads to the entry of germs into the human body through food, water, and respiration. Therefore, the construction of a toilet in every household is a mandatory requirement. Currently, the government and various non-governmental organizations are seen to have given priority to toilet construction. Private houses and public places must have mandatory toilets along with handwashing water. In case poor community families cannot construct toilets themselves, the government, especially the local government, should provide subsidies for toilet construction.
Table No. 78: Details of households based on the type of toilet used by the family
| Ward No. | Flush system (Public sewerage) | Flush system (Septic tank) | Pit toilet | Community toilet | No toilet | Total |
|---|---|---|---|---|---|---|
| 1 | 28 | 1900 | 225 | 1 | 13 | 2167 |
| 2 | 17 | 1142 | 197 | 4 | 3 | 1363 |
| 3 | 83 | 408 | 59 | 3 | 3 | 556 |
| 4 | 70 | 2679 | 119 | 13 | 37 | 2918 |
| 5 | 34 | 702 | 387 | 5 | 9 | 1137 |
| 6 | 39 | 881 | 469 | 1 | 21 | 1411 |
| 7 | 7 | 478 | 188 | 2 | 7 | 682 |
| 8 | 68 | 695 | 47 | 13 | 29 | 852 |
| 9 | 80 | 1235 | 102 | 5 | 3 | 1425 |
| 10 | 90 | 2411 | 134 | 4 | 24 | 2663 |
| 11 | 38 | 876 | 52 | 9 | 26 | 1001 |
| 12 | 13 | 1329 | 373 | 4 | 19 | 1738 |
| 13 | 67 | 633 | 486 | 20 | 260 | 1466 |
| 14 | 14 | 289 | 442 | 4 | 307 | 1056 |
| 15 | 70 | 378 | 230 | 10 | 457 | 1145 |
| 16 | 9 | 483 | 489 | 5 | 114 | 1100 |
| 17 | 60 | 675 | 227 | 6 | 252 | 1220 |
| 18 | 59 | 2005 | 585 | 10 | 43 | 2702 |
| 19 | 13 | 1029 | 448 | 41 | 180 | 1711 |
| 20 | 280 | 1967 | 710 | 19 | 322 | 3298 |
| 21 | 2 | 554 | 655 | 18 | 324 | 1553 |
| 22 | 8 | 449 | 155 | 0 | 454 | 1066 |
| 23 | 1 | 128 | 35 | 0 | 171 | 335 |
| Total | 1150 | 23326 | 6814 | 197 | 3078 | 34565 |
| Percentage | 3.33 | 67.48 | 19.71 | 0.57 | 8.90 | 100 |
Out of the total households in the sub-metropolitan city, the highest 67.48 percent use Flush system (Septic tank), 3.33 percent use Flush system (Public sewerage), 19.71 percent use Pit toilet, 0.57 percent use Community toilet and 8.90 percent do not use a toilet and defecate in open places. Whose detailed breakdown by ward is mentioned in the table.
Details of households based on the type of toilet used by the family
Tap bars or slices to view details
5.3.3 Public Toilet Details
Private houses and public places must have a toilet along with handwashing water. In case poor community families cannot construct a toilet themselves, the local government should provide a subsidy for toilet construction. To make the house courtyards, roads, markets and public areas of this Sub-Metropolitan City clean, public toilets have been constructed in various places. To keep public toilets clean, the Tole Health Committee and the Sub-Metropolitan City must play an important role. By charging some fee for using the public toilet, the expenses for cleanliness and management of the toilets can be covered, and along with this, house courtyards, markets, and roads remain clean, which can also provide some contribution to the revenue of the Sub-Metropolitan City. The details of an adequate number of public toilets in this Sub-Metropolitan City are mentioned in the table.
Table No. 79: Public Toilet Details
| S.N. | Location of toilet | Ward No. |
|---|---|---|
| 1. | Inside Bageshwari Temple | 2 |
| 2. | North of Drinking Water Corporation Office | 2 |
| 3. | In front of Bheri Hospital | 10 |
| 4. | Near Meat Market | 13 |
| 5. | Near Vegetable Market | 8 |
| 6. | In front of Agricultural Development Bank | 12 |
| 7. | In front of Mini Zoo-Park | 8 |
| 8. | Salyani Bungalow | 4 |
| 9. | North of Municipality Office | 12 |
| 10. | Babugaun | 14 |
| 11. | Near Customs | 15 |
| 12. | Jayaspur (Near Highway) | 16 |
| 13. | 100 meters west from Chaulika Chowk | 17 |
| 14. | North of Hanuman Temple | 18 |
| 15. | Near Ward Office | 19 |
| 16. | Ranjha Chowk | 20 |
| 17. | Near Ward Office | 21 |
| 18. | Near Kanti Lake | 22 |
| 19. | Bhajjupuruwa | 23 |
5.3.4 Waste Management Household Details
Especially in urban areas and market centers where population density is high, the waste generated by humans, industries and factories not only disfigures the beauty of the settlement but also has a negative impact on public health. In such a situation, the waste management system must be addressed in a long-term manner by both the government and the community. Understanding that waste harms both health and beauty, proper management of waste is necessary. Organic compost can also be made from some degradable waste. Although the Sub-Metropolitan City has not systematically initiated waste management work, locals have been managing degradable and non-degradable waste in a traditional way.
Problems seen in waste management:
Currently the problems seen in this Sub-Metropolitan City are as follows:
In the name of waste management, the tendency of uncontrollably throwing waste in the lower parts of rivers and rivulets is seen everywhere. Waste thrown in this way is washed away by water during rains and taken down to the lower parts of rivers and rivulets, expanding the pollution.
Since the lower parts of the land are also water sources and the exact same water appears on the surface and seeps inside the ground, the waste thrown in the lower parts pollutes both the surface water and the groundwater.
Things to consider in solid waste management:
Separating the waste coming out of the kitchen into degradable and non-degradable.
The Sub-Metropolitan City should conduct programs to provide training for using degradables as compost and to motivate every house owner.
Re-sorting the non-degradable waste at different levels like wood, plastic, metal, glass. After identifying these wastes as per necessity, emphasizing towards related service management for those who can be reused. Managing to sort scientifically in the open spaces of this Sub-Metropolitan City area where there is no water source.
5.3.5 Drainage and Landfill Status
In city market centers and areas with integrated settlements, there must be good management of sewerage. Drainage is also a significant infrastructure of physical development. If drainage management is done along with road construction, the government is saved from double expenditure incurred in infrastructure development. In addition to this, the waste emitted from human settlements should be managed by making a landfill site at a certain distance from human settlements. A clean and clear environment without waste is a sign of civilization.
The sub-metropolitan city has not been able to properly manage drainage reasonably. However, the sub-metropolitan city is committed to moving forward by drafting an urban development plan. A specific landfill site for solid waste management couldn't be arranged in the sub-metropolitan city area.
5.3.6 Houseless Environment
According to Article 39 sub-article 9 of the Constitution of Nepal, in fundamental rights, helpless, orphan, disabled, conflict victim, displaced and at-risk children shall have the right to get special protection and facilities from the state, while Article 43 states that financially poor, incapacitated and helpless status individuals, helpless single women, persons with disabilities, children, citizens who cannot take care of themselves and citizens of endangered castes shall have the right to social security according to the law. Therefore, as a local government, the sub-metropolitan city has a mandatory obligation to protect children and other citizens who are in such a helpless situation.
5.4 Art, Language and Culture
5.4.1 Details of Local Festivals, Jatras and Fairs
People of different castes, religions, sects, and customs live in this sub-metropolitan city. While the majority of the people living here follow the Hindu religion, some people following Hindu, Christian, Islam, and Jain religions also reside here. All castes and sects have their own kind of religious culture and customs. Among them, festivals like Bada Dashain, Tihar, Ram Navami, Maha Shivaratri, Haritalika, Shree Panchami, Shree Krishna Janmashtami, Bibaha Panchami, Holi, Chaite Dashain, Saune-Maghe Sankranti, Matatirtha Aunsi, Akshaya Tritiya, Harishayani-Haribodhini Ekadashi, Nag Panchami, Rakshabandhan (Janai Purnima), Kushe Aunsi, Bala Chaturdashi, Kojagrat Purnima, Shree Swasthani Purnima, Chhath, Eid, Buddha Jayanti, Christmas Day, Bakra Eid, Asare 15, etc. are celebrated. The details regarding local festivals, jatras, and fairs celebrated in this sub-metropolitan city are mentioned in the table.
Table No. 80: Details of Local Festivals, Jatras and Fairs
| S.N. | Festival/Jatra/Fair | When it is celebrated | Celebrating Caste/Community |
|---|---|---|---|
| 1. | Dashain, Tihar, Teej, Maghi, Holi Purnima, Krishnashtami, and other festivals | Hindu | |
| 2. | Shivaratri, Saune Sankranti, Chaite Dashain | Falgun, Saun, Chait | |
| 3. | Maghe Sankranti, Teej, Krishna Janmashtami | Hindu | |
| 4. | Krishna Janmashtami | Bhadra | Hindu |
| 5. | Shivaratri Festival | Shivaratri | Hindu |
| 6. | Holi (Fagu Purnima) | Falgun | Hindu |
| 7. | Ghume (Bhumya) Festival | Hindu | |
| 8. | Christmas | Poush | Christian |
| 9. | Eid | Muslim | |
| 10. | Chhath | Kartik | Maithili |
5.5 Details of Peace and Security
As mentioned in the constitution, the state should be able to make the citizens feel secure. It is the responsibility of the state to provide civil security to the citizens of every nation. A citizen should be able to feel secure in their state. To make this efficient, civil society also plays an equally important role.
Criminal and socially unacceptable activities such as theft and robbery occurring in the sub-metropolitan city are found to be resolved through these security agencies. According to the locals, incidents of minor quarrels, beatings, boundary disputes, theft, robbery, fraud, and domestic violence occur occasionally in the Sub-Metropolitan City. Security agencies have been established in 6 places within this sub-metropolitan city, the detailed description of which is presented in the table.
Table No. 81: Details of major security agencies in the Sub-Metropolitan City
| S.N. | Name of Security Agencies | Location |
|---|---|---|
| 1. | Shree No. 4 Brigade Headquarters Imamnagar Barracks | Nepalgunj Sub-Metropolitan City Ward No. 20 Ranjha |
| 2. | Karnali Province Police Training Center Surkhet, (Currently Nepalgunj) | Nepalgunj Sub-Metropolitan City Ward No. 18 Karkando |
| 3. | Nepal Police Special Security Battalion Kohalpur, Banke (Currently Nepalgunj) | Nepalgunj Sub-Metropolitan City Ward No. 01 Nepalgunj |
| 4. | Nepal Police Province Office Karnali Province (Currently Nepalgunj) | Nepalgunj Sub-Metropolitan City Ward No. 18 Karkando |
| 5. | District Police Office, Banke. | Nepalgunj Sub-Metropolitan City Ward No. 01 Nepalgunj |
| 6. | Ward Police Office Nepalgunj, Banke | Nepalgunj Sub-Metropolitan City Ward No. 5 Banke. |
| 7. | Temporary Traffic Police Post | Nepalgunj Sub-Metropolitan City Ward No. 10 Banke. |
| 8. | Shree No. 4 Brigade Headquarters Imamnagar Barracks | Nepalgunj Sub-Metropolitan City Ward No. 20 Ranjha |
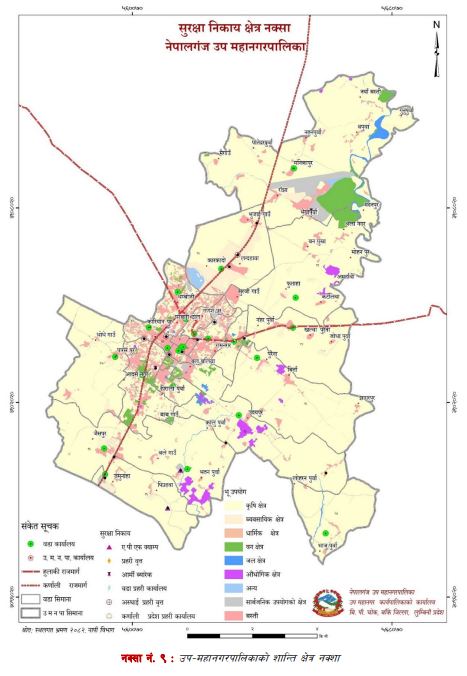
Map No. 9: Peace Area Map of Sub-Metropolitan City
Forest and Environmental Status
Forest area, water resources, biodiversity, and disaster risk management
6.1 Forest Area Status
Although there are no forest areas within the total land area of the sub-metropolitan city, 2.61 percent of the land area is covered by bush and shrubland. Goal No. 15 of the Sustainable Development Goals (SDGs) highlights the importance of sustainable management of forests, combating desertification, halting and reversing land degradation, and halting biodiversity loss. Therefore, to maintain the balance of the environmental system, cleanliness of the atmosphere, and habitats for flora and fauna, the conservation of forests must be prioritized. Moreover, by extensively involving the public in plantation programs on fallow lands and riverbanks outside forest areas, the sub-metropolitan city can be developed as a 'green garden,' linking forests to income generation even in limited amounts. Similarly, it seems necessary to conduct plantation, dam construction, wire fencing, embankment, and traditional flood/inundation control and soil conservation programs in highly sensitive areas. Since plantation is an effective measure for soil conservation, prioritizing this task is essential.
6.1.1 Forest Management Description (Government-managed, Community, Leasehold, Religious, and Private Forest)
a. Community Forest
A community forest refers to a national forest handed over to a user group for the development, conservation, and utilization for collective benefit. According to the Nepal Government's policy of involving local residents in forest conservation and utilization, the District Forest Office has been forming Community Forest User Groups and handing over forests in this sub-metropolitan city as well.
When this program was initially implemented, the objective was to increase greenery on bare hills and slopes and to fulfill basic needs for timber, fuel-wood, and fodder for the general public. However, the program now includes new issues like poverty alleviation, livelihoods, and biodiversity conservation. Over the past few years, there has been a new awakening among the public living around forest areas. As a result of the concern for their own community forests, areas that were bare, facing desertification, or affected by streams and torrents are now naturally conserved.
To make forest management effective, it is essential to ensure community forests have access to sources, resources, and technically skilled manpower. In addition to traditional forest conservation methods among users, it is necessary to develop new methods and work styles. The details of community forests registered in this sub-metropolitan city are mentioned below.
| S.N. | Name of Community Forest | Current Address | Area (Ha) |
|---|---|---|---|
| 1 | Pashupati Community Forest User Committee | Nepalgunj 20 and 19 | |
| 2 | Jhora Community Forest User Committee | Nepalgunj 21 | |
| 3 | Hazrat Community Forest User Committee | Nepalgunj 23 |
b. National Forest
National forest refers to a forest-related work plan prepared to develop, conserve, and utilize or sell forest products while maintaining environmental balance. National forests include all forests within Nepal, whether they have marked boundaries or not, excluding private forests.
c. Block Forest (Chakala Wan)
Block forest refers to any part of a government-managed forest with an area of at least five hundred hectares.
d. Collaborative Forest (Sajhedari Wan)
Collaborative forest refers to any part of a national forest managed in partnership with the Division Forest Office, local level, and users.
e. Religious Forest
Religious forest refers to a national forest handed over to any religious institution, group, or community for the development, conservation, and utilization of the forest.
f. Private Forest
Private forest refers to a forest raised or conserved on private land owned by an individual according to current laws.
g. Leasehold Forest (Kabuliyati Wan)
Leasehold forest refers to a national forest leased out according to current laws to any established institution, any industry based on forest products, or any community to achieve various objectives. Leasehold forests are separated to achieve objectives as follows:
(a) To produce raw materials required for forest product-based industries,
(b) To increase forest product production through plantation for sale or utilization,
(c) To conduct tourism businesses,
(d) To conduct agro-forestry operations,
(e) To conduct insect and wildlife farming.
6.1.2 Details of Available Space for Plantation
The banks of rivers and streams like the Duduwa River, playgrounds, community forest areas, etc., within this sub-metropolitan city are available as empty spaces for plantation.
6.1.3 Details of Herbal Production, Collection, and Export
Various types of medicinal herbs are found in the Nepalgunj sub-metropolitan city area. The details of important local medicinal herbs found here are presented in the table below.
| S.N. | Nepali Name | English Name | Scientific Name |
|---|---|---|---|
| 1 | Asuro | Malabar nut | Adhatoda vasica Nees |
| 2 | Aduwa | Ginger | Zingibar officinale Rose |
| 3 | Aank | Madar | Calotropis procera |
| 4 | Karela | Bitter Gourd | Memordia charantia Linn. |
| 5 | Kagati | Lemon | Citrus aurantifolia (Christm) Swingle |
| 6 | Kans | Thatch grass | Saccharum spontareum Linn. |
| 7 | Kurilo | Asparagus | Asparagus racemosus Willd. |
| 8 | Kush | Kus-grass | Desmostachya bipinnata Staff |
| 9 | Kera | Banana | Musa parasiciaca Linn. |
| 10 | Gurjo | Tinosphora cordifolia Willd Miers | |
| 11 | Gulaf | Rose | Rosa sp. |
| 12 | Ghanti phul (Barhamas) | China rose | Hibiscus rosa-sinensis Linn. |
| 13 | Ghodatabre | Water pennywort | Centella asistica (Linn.) Vrbm |
| 14 | Ghyukumari | Aloe | Aloe barbadensis Mill |
| 15 | Chari amilo | India sorrel | Oxalis carniculata Linn. |
| 16 | Titepati | Mug-wort | Artemisia vulgaris Linn. |
| 17 | Tulasi | Holy basil | Ocimum sanctum Linn. |
| 18 | Dudhesar | Euphorbia thymifolia L | |
| 19 | Dubo | Conch grass | Cynodon dactylon Pers |
| 20 | Dhaturo | Datura | Datura metel Linn. |
| 21 | Dhaniya | Coriander | Corienfrum sativum Linn. |
| 22 | Dhageri | Fire flame bush | Woodforbia fruiticosa Kutz. |
| 23 | Simall (Nirgundi) | Fire-leaved chaste | Vitex negundo Linn. |
| 24 | Neem | Neem tree | Azadhiracta indica A.Juss |
| 25 | Parijat | Night Jusmine | Nyctantanthes arbor-tristis Linn |
| 26 | Palungo | Spinas | Spicia oleracea Linn. |
| 27 | Pipla | Long pepper | Piper longum Linn. |
| 28 | Pudina | Garden mint | Mentha spicata Linn. |
| 29 | Bihi | Solanum indicum Linn. | |
| 30 | Bethe | Lambs quarters | Chenopoidium album L |
| 31 | Bojho | Sweet flag | Acorus calamus Linn. |
| 32 | Mula | Radish | Raphanus sativus Linn. |
| 33 | Mothe | Nut Grass | Cyperus rotundus Linn. |
| 34 | Lajjawati | Sensitive plant | Mimosa pudica Linn. |
| 35 | Lasun | Garlic | Allium sativum Linn. |
| 36 | Lunde | Pickly amaranth | Amaranthus spinosus L. |
| 37 | Sarpagandha | Serpentina | Rauwolfia serpentine Bethex Kurz |
| 38 | Sayapatri | Marigold | Tagetus erecta Linn. |
| 39 | Sidhure | Kamala | Mallotus Phillipinensis Muell.Arg. |
| 40 | Sup | Dill | Anethum sowa Kurz |
| 41 | Haledo | Turmeric | Curcuma longa Linn. |
6.2 Water Resources and Watershed
The streams and rivulets, including the Duduwa stream, located in this sub-metropolitan city, are the main sources of local watersheds. More than 18 natural ponds and lakes, including the Duduwa stream, Rapti river, and Waterpark pond, Phulteka pond, Rani Pond, Futaha pond, Kanti pond, Pakaniya pond, Bhatarawanwa pond, and Suiya pond, are the main sources of water in this sub-metropolitan city.
6.2.1 Major Rivers and Streams
The streams and rivulets spread across various geographical areas and wards of the sub-metropolitan city provide abundant water storage as well as shelter as a safe habitat for various types of aquatic animals and birds. Additionally, animals drink water from these streams, and farmers occasionally use the water for partial irrigation. Along with the development of human settlements and the pressure of migration, excessive grazing by unproductive animals and utilization are leading to soil erosion and the gradual filling up of natural rivers and streams.
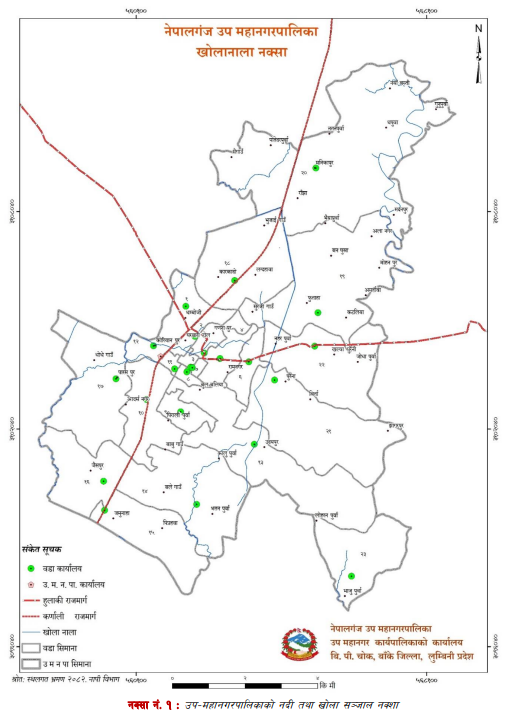
Map of Rivers and Streams in Nepalgunj Sub-Metropolitan City
| S.N. | Rivers and Streams in the City | Address |
|---|---|---|
| 1. | Duduwa River | |
| 2. | Rapti River |
| S.N. | Name of Lakes, Ponds, and Wetlands | (Number of Ponds) | Ward No. |
|---|---|---|---|
| 1. | Waterpark Pond | 1 | 1 |
| 2. | Phulteka Pond | 1 | 6 |
| 3. | Rani Pond | 1 | 8 |
| 4. | Futaha Pond | 1 | 19 |
| 5. | Kanti Pond | 1 | 22 |
| 6. | Pakaniya Pond | 1 | 15 |
| 7. | Bhatarawanwa Pond | 1 | 15 |
| 8. | Suiya Pond | 1 | 15 |
| 9. | Gahaha Pond | 1 | 15 |
| 10. | Pripahwa Pond | 1 | 15 |
| 11. | Paschim Pond | 1 | 15 |
| 12. | Idgah Pond | 1 | 16 |
| 13. | Kanti Pond | 1 | 22 |
| 14. | Lakdhawa Pond | 1 | 18 |
| 15. | Muniya Pond | 1 | 20 |
| 16. | Khaiju Pond | 1 | 20 |
| 17. | Marghatiya Pond | 1 | 20 |
| 18. | Pandit Pond | 1 | 20 |
6.3 Biodiversity and Environmental Service
6.3.1 Important Animals and Birds Based on Habitat
a) Major Wildlife
Major wildlife found in this sub-metropolitan city include rabbits, monkeys, foxes, porcupines, and others.
b) Reptiles and Amphibians
Reptiles and amphibians found in this sub-metropolitan city especially include snakes, water snakes, lizards, monitor lizards, and frogs.
c) Insects and Small Creatures
Butterflies, grasshoppers, dragonflies, crickets, fireflies, wasps, bees, spiders, mites, and centipedes are among the insects and small creatures found here.
6.3.2 Important Vegetation Details
As the forest area in the sub-metropolitan city is very negligible, there is a lack of vegetation typically found in forest areas. Therefore, in addition to bushes and shrubs, there is availability of fruit trees and plants.
6.4 Disaster Risk Management
The sub-metropolitan city faces recurring disasters like flooding, pandemics, hailstorms, strong winds, cold waves, and wild animal attacks. Recently, post-COVID-19, dengue has emerged as a major disaster. Additionally, road accidents, cold waves, and heatwaves are subsidiary disasters. The risk of earthquakes can never be ruled out. Floods and erosion from rivers and seasonal streams flowing south from the northern Chure hills cause significant loss of life and property in this sub-metropolitan city. It also severely impacts seasonal crops, off-season vegetable farming, and riverbed (bagar) farming.
Management and repair of unpaved roads, streams, culverts, and irrigation canals within the sub-metropolitan city can reduce the impact of uncontrolled floods caused by the Duduwa and Rapti rivers. For disaster risk reduction, the sub-metropolitan city has prioritized policy arrangements, awareness, and capacity-building programs, as well as prevention and emergency preparedness activities for vulnerable communities and all residents.
Basically, human activities concentrated around the streams of the sub-metropolitan city have negatively impacted flood-prone areas. Embankments and proper drainage systems are needed to stop this trend. Similarly, frost, hailstorms, and strong winds destroy food and fruit crops. Addressing flood risks requires short-term measures like building embankments, medium-term measures like plantation in affected areas, and long-term protection of all river-affected areas and reducing human-wildlife conflict. It has also been identified that intensive watershed conservation programs should be operated while making these areas unaffected by human activities.
6.4.1 Human and Physical Damage from Disasters
In this sub-metropolitan city, floods (inundation and erosion) during the monsoon cause human and physical damage. This leads to physical damage for many households every year. Problems include land erosion, damage to fish ponds, livestock loss, damage to crops and infrastructure, and disease outbreaks due to the lack of clean water and sanitation.
6.4.2 Risk Time by Disaster Type
| S.N. | Potential Disaster | Current Status | Time |
|---|---|---|---|
| 1. | Flooding (Inundation, Erosion) | Rivers and streams cause erosion and inundation of land and settlements during monsoon. Numerous families are affected annually. | June-October |
| 2. | Strong Wind/Lightning | Blowing away roofs of houses made of thatch, straw, or tile; problems with lightning strikes. | March-May |
| 3. | Pandemic | Increase in waterborne diseases like diarrhea, lack of resources and awareness, lack of adaptive capacity. | Post-disaster, others |
| 4. | Fire / Forest Fire | Electrical short circuits, human negligence, dense settlements, lack of fire-fighting equipment, other causes. | March-May |
| 5. | Hailstorm | Impacts cereal crops and roofs of unpaved houses. | March-May |
| 6. | Viruses (COVID, Bird Flu, etc.) | Lack of pure drinking water and sanitation, unmanaged poultry farming, swine flu, etc. | Anytime |
| 7. | Earthquake | Nepal ranks 11th in seismic risk; building code not fully implemented in municipal buildings. | Anytime |
| 8. | Cold Wave | Vulnerable groups like elderly and children fall ill; extreme poor families highly affected. | December-January |
| 9. | Heatwave (Loo) | Extreme heat reaching up to 46° causing fainting, swelling, cramping, and mental health issues. | June-August |
| 10. | Drought (Extreme Heat) | Impacts the production of food crops and vegetable crops due to drought. | May-July |
| 11. | Insects and Pests | Damage to crops and production due to insects along with climate change. | As per season |
6.4.3 Disaster Preparedness
| Local Emergency Operation Center (LEOC), Nepalgunj SMC | |||||
|---|---|---|---|---|---|
| Search and Rescue Stock (2080) | |||||
| S.No | List Of Materials | Stock | Total | ||
| GIZ | SUPER | LEOC | |||
| 1 | Pick axe with bit | 5 | 10 | 18 | 33 |
| 2 | Shovel | 0 | 10 | 17 | 27 |
| 3 | Spade with bit | 10 | 5 | 24 | 39 |
| 4 | Sledge hammer | 5 | 7 | 11 | 23 |
| 6 | Crow bar | 0 | 15 | 0 | 15 |
| 9 | Saw frame | 10 | 10 | 0 | 20 |
| 11 | Hand shaw blade | 0 | 100 | 0 | 100 |
| 12 | Carpenter hammer | 0 | 20 | 16 | 36 |
| 17 | Crescent pipe wrench 12' | 0 | 5 | 0 | 5 |
| 18 | Crescent | 0 | 5 | 0 | 5 |
| 19 | Screw driver set | 0 | 5 | 0 | 5 |
| 20 | Slide wrench 12'15" | 0 | 15 | 0 | 15 |
| 22 | Spanner set | 0 | 5 | 0 | 5 |
| 23 | Tape measuring 50,5 mtr cloth | 2 | 15 | 0 | 17 |
| 25 | Ladder | 1 | 1 | 0 | 2 |
| 26 | Stretcher 3 folding | 10 | 3 | 0 | 13 |
| 27 | Safety helmet | 15 | 15 | 15 | 45 |
| 28 | Safety vest | 0 | 15 | 0 | 15 |
| 29 | Ear plug | 0 | 20 | 0 | 20 |
| 30 | Gloves | 20 | 10 | 3 | 33 |
| 31 | Knee pad | 0 | 1 | 0 | 1 |
| 32 | Scene tape | 0 | 1 | 0 | 1 |
| 33 | Safety belt | 0 | 1 | 0 | 1 |
| 34 | Jack screw | 0 | 3 | 0 | 3 |
| 36 | Search light | 5 | 5 | 0 | 10 |
| 37 | Protective glass | 15 | 5 | 0 | 20 |
| 38 | Nylon rope | 0 | 5 | 0 | 5 |
| 39 | Rope | 0 | 0 | 65 | 65 |
| 40 | Life jacket | 15 | 10 | 0 | 25 |
| 41 | Throw bag | 5 | 5 | 0 | 10 |
| 42 | Chain Saw | 0 | 1 | 0 | 1 |
| 43 | Back Board | 0 | 1 | 0 | 1 |
| 44 | Wheel barrow | 0 | 1 | 0 | 1 |
| 45 | Blanket | 50 | 0 | 55 | 105 |
| 46 | Mosquito net | 0 | 0 | 100 | 100 |
| 47 | Big bag | 0 | 0 | 100 | 100 |
| 48 | Bed sheet | 0 | 0 | 100 | 100 |
| 49 | Tarpaulin | 40 | 0 | 15 | 58 |
| 50 | Boot | 15 | 0 | 99 | 114 |
| 51 | Mat | 0 | 0 | 30 | 30 |
| 52 | Rubber mattress | 50 | 0 | 0 | 50 |
| 53 | Climbing rope | 120 | 0 | 0 | 120 |
| 54 | Bucket | 10 | 0 | 0 | 10 |
| 55 | Pickaxe | 10 | 0 | 0 | 10 |
| 56 | Fire extinguisher | 2 | 6 | 0 | 8 |
| 57 | First aid kit | 2 | 0 | 0 | 2 |
| 58 | Fire blanket | 1 | 0 | 0 | 1 |
| 59 | Adjustable wrench | 2 | 0 | 0 | 2 |
| 60 | Tool set box | 1 | 0 | 0 | 1 |
| 62 | Drill machine | 1 | 0 | 0 | 1 |
| 63 | Chain saw | 1 | 0 | 0 | 1 |
| 64 | Thermal gun | 5 | 0 | 0 | 5 |
6.4.4 Details of Emergency Transportation
Although health services are accessible in the center of the sub-metropolitan city, it has not been possible to provide emergency health services from health institutions in all wards. To provide health services to patients in emergency situations, 28 ambulances with 24-hour service and 3 fire engines are in operation within the city. This sub-metropolitan city has also not been untouched by the effects of uncontrolled forest fires. Therefore, while fire engine management is good, it is necessary to arrange for ward-wise ambulances to provide services in emergency situations in various communities. The details of emergency transportation vehicles are included in the table below.
| S.N. | Name of Vehicles | Number |
|---|---|---|
| 1. | Fire Engine | 3 |
| 2. | Fire Bike | 1 |
| 3. | Animal Ambulance | 1 |
| 4. | JCB | 2 |
| 5. | Chain Dozer | 1 |
| 6. | Water Tanker | 1 |
| 7. | Ambulance (within Sub-Metropolitan City) | 28 |
Physical Infrastructure Development
Transportation, electricity, communication, and housing
7.1 Transportation Infrastructure
7.1.1 Current Road Network Status
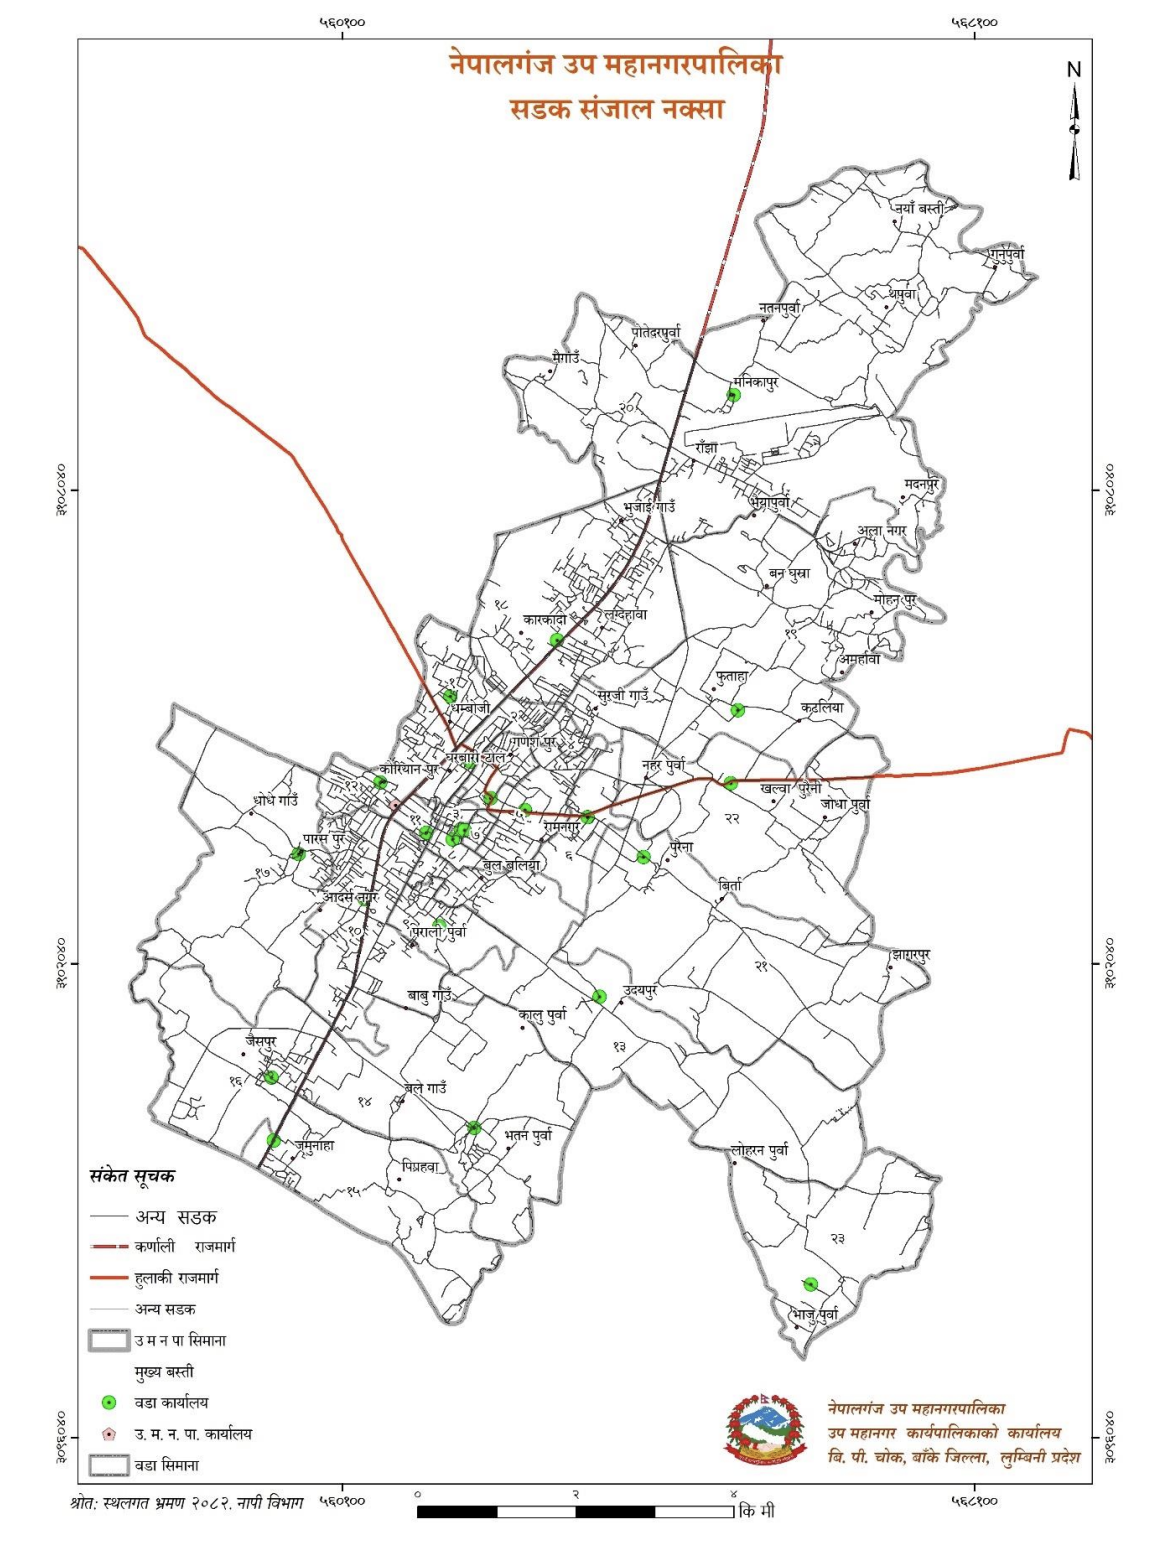
Map No. 2: Road Network Map of Sub-Metropolitan City
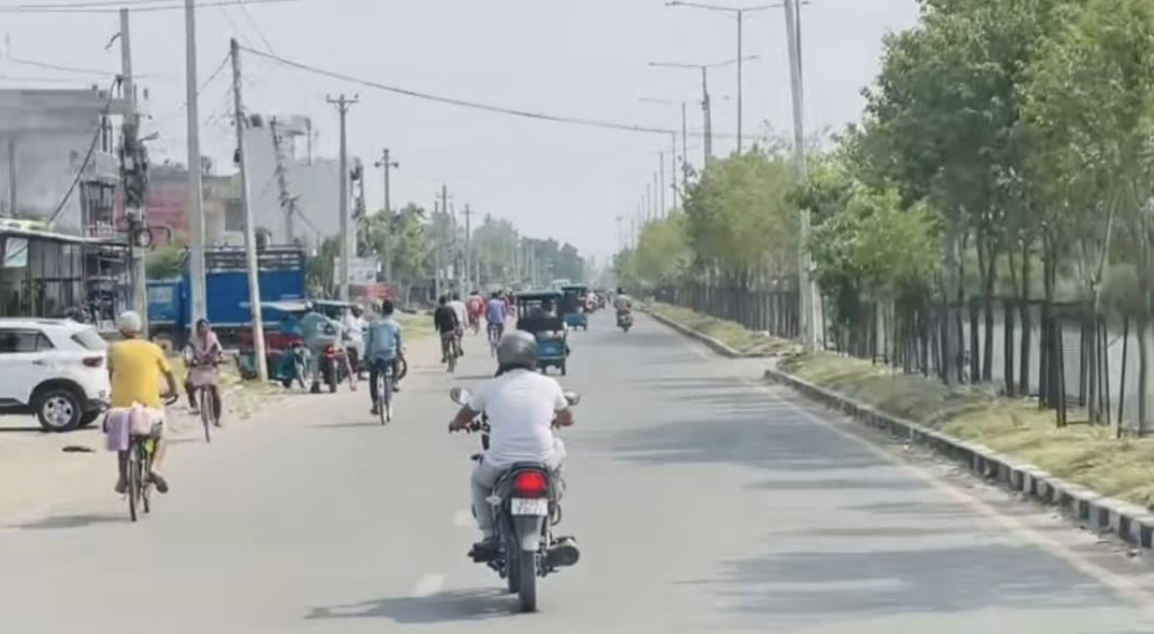
Rupanihiya Road
Road network is the primary prerequisite for physical development of any place. The door of overall development opens with the development of fully equipped road transportation. At the local level, it is necessary to connect ward centers with the city center and the city center to the national highway system through district roads. In urban settlements, agricultural products can be marketed through the development and upgrading of agricultural roads, thereby strengthening the economic condition of the people. Economic revolution is possible through the development of industries and tourism sector via well-equipped road networks. In addition, internal and external tourists can be attracted by providing access to religious areas through road networks.
New Road
Until the mapping work of 2050 BS, the road condition in hilly areas of Nepal was quite weak. However, after the political change of 2046, as per the practice of allocating funds from the national treasury to local bodies, road expansion work gained momentum in rural areas as well. Subsequently, rural areas have also made significant progress in road network expansion. However, due to difficult hilly terrain, mapping of some such local structures could not be done and in the absence of factual information, it is not possible to confirm how much road network expansion has taken place in those areas. In this context, the concept of Municipality Transport Master Plan (MTMP) was established to systematically manage transportation networks based on maps and data of each municipality/area's transportation network. Accordingly, the road transportation master plan has been formulated and implemented in this sub-metropolitan city as well.
For air transportation in this sub-metropolitan city, daily domestic flights operate from Nepalgunj Airport. In addition, national highways such as Surkhet Road (Ratna Highway), Khajura Road (Nepalgunj-Guleria Road), Airport Road (Sanpha-Airport), Bus Park Road, and Postal Highway (Nepalgunj-Baghauda Road) are the main road transportation routes. According to the data obtained from the transportation master plan of the sub-metropolitan city, there are 41 Class A roads, 96 Class B roads, and 139 Class C roads in operation. Similarly, there are 26 bridges and 62 culverts of various sizes in operation within the municipality. Road and transportation development helps increase productivity, provide access to health and education services, create employment, reduce poverty, and support economic and social development. The sub-metropolitan city needs to take necessary steps to improve road and transportation conditions.
Nepalgunj Airport
Development of routes is essential to make public transportation easy, effective, affordable, and regular for establishing mutual contact between people living in different places and geographical areas. When transportation services come into operation on different routes, it connects different communities and areas together, establishing a sense of unity among the people.
7.1.2 Vehicles in Sub-Metropolitan City Area
Currently in Nepal's urban areas and market centers, long-distance buses, minibuses, Hiace vans, and micro buses are found in operation under road transportation, while for short distances, microbuses, motorcycles, rickshaws, bicycles, tempos, Tata vehicles and similar modes of transport are available. Among these vehicles, some are private and some are public.
Vehicles operating in the Sub-Metropolitan City
Transportation serves as an important infrastructure for making the economic and social development of any area dynamic, simplifying the flow of public goods and services, and developing the agricultural and non-agricultural sectors. In this sub-metropolitan city, trucks, tractors, jeeps, buses, motorcycles, rickshaws, tangas, bicycles, and DV vehicles are mainly used. All roads of the sub-metropolitan city need to be upgraded to be operational throughout the twelve months of the year. Additionally, various infrastructure required for road transportation such as vehicle parking areas, bus stops, passenger waiting areas, street lights, road signs, and bus terminal facilities need to be systematically developed.
7.1.3 Bus Park and Bus Stop Description
Bus parks equipped with facilities such as electricity, water, passenger waiting areas, toilets, and public mobile charging stations can be constructed to make public movement convenient. Looking at the practices of developed countries, bus parks are found to have proper arrangements for help desks and peace and security. When well-equipped and secure bus parks are constructed, the quality of transportation service increases. Structures built in bus parks must be disability-friendly. In this sub-metropolitan city, although bus parks and bus stops exist, they have not been properly organized. Similarly, the main market areas of the sub-metropolitan city serve as bus stops. There is a lack of passenger waiting areas and toilets here.
Nepalgunj Bus Park
7.1.4 Suspension Bridge and Culverts
According to data, this metropolitan city has 1 motorable bridge and 2 suspension bridges. The detailed description is presented in the table below.
| S.N. | Name of Motor/Suspension Bridge | Ward No. | Remarks |
|---|---|---|---|
| 1 | Nayabasti Ganapur Suspension Bridge | 20 | |
| 2 | Sano Nepal Alanagar Suspension Bridge | 20 | |
| 3 | Dhudhuwa Khola Permanent Bridge | 20 |
7.2 Electricity and Alternative Energy
Although all wards of the sub-metropolitan city have access to electrification, the electricity capacity remains low due to the increasing population and needs to be enhanced. To improve peace and security, solar streetlights and CCTV cameras need to be installed on the roads. However, extensive work is required for the strengthening of transmission lines. In terms of improving electricity transmission lines, wooden poles must first be replaced with concrete or iron poles, and transformers need to be installed in areas with low voltage.
Apart from electricity services, solid programs should be run to promote alternative and renewable energy. Encouraging and providing subsidies for the construction of biogas in animal husbandry areas, and installing solar energy in both remote and accessible areas, can ensure a regular supply of energy and boost further development activities through efficient energy utilization. Solar energy can also be used for lift irrigation and drinking water projects, and surplus energy generated for domestic consumption can even be sold to the national grid.
Generally, an average family consumes 2 kilowatts of electricity daily. Even this consumption rate is lower in rural areas. A solar panel of 17.6 square feet produces 250 watts of electricity. Approximately 6.8 hours of sunlight per day (250 watts x 6.8 hours) yields 1.7 kilowatts of electricity. Producing 1.7 kilowatts x 30 days can generate 51 kilowatts of electricity per month.
This means from a house occupying 600 square feet:
51 kW x 600 / 17.6 = 1738 kW
This implies that by installing solar energy in a house covering 600 square feet, the required energy for that house can be produced. However, rural houses need to be made solar energy-friendly. On the other hand, small hydropower projects can be operated by studying the potential of perennial water sources and reservoir-based electricity. Surplus electricity generated this way can be sold to the national grid.
Until now, many households still use wood/firewood as their primary cooking fuel. Electricity and solar energy can help replace wood/firewood. This also contributes to environmental conservation. Therefore, it is necessary to conduct programs for the maintenance and improvement of electricity transmission lines, installation of transformers, and promotion of alternative and renewable energy in various wards of the sub-metropolitan city.
7.2.1 Fuel Usage Details (Households Based on Cooking Fuel)
| Ward | Wood, Firewood, Coal | LP Gas | Electricity | Cow Dung (Guitha) | Bio Gas | Kerosene | Others | Total |
|---|---|---|---|---|---|---|---|---|
| 1 | 99 | 1843 | 9 | 0 | 206 | 10 | 0 | 2167 |
| 2 | 55 | 1305 | 2 | 1 | 0 | 0 | 0 | 1363 |
| 3 | 28 | 525 | 1 | 1 | 1 | 0 | 0 | 556 |
| 4 | 108 | 2782 | 14 | 0 | 1 | 0 | 13 | 2918 |
| 5 | 63 | 1047 | 25 | 2 | 0 | 0 | 0 | 1137 |
| 6 | 102 | 1304 | 4 | 0 | 1 | 0 | 0 | 1411 |
| 7 | 6 | 671 | 0 | 0 | 3 | 0 | 2 | 682 |
| 8 | 36 | 811 | 5 | 0 | 0 | 0 | 0 | 852 |
| 9 | 115 | 1296 | 13 | 0 | 1 | 0 | 0 | 1425 |
| 10 | 106 | 2538 | 11 | 1 | 4 | 0 | 3 | 2663 |
| 11 | 52 | 946 | 0 | 1 | 2 | 0 | 0 | 1001 |
| 12 | 114 | 1616 | 5 | 2 | 1 | 0 | 0 | 1738 |
| 13 | 382 | 1082 | 0 | 0 | 1 | 1 | 0 | 1466 |
| 14 | 557 | 498 | 0 | 0 | 1 | 0 | 0 | 1056 |
| 15 | 579 | 552 | 4 | 7 | 0 | 3 | 0 | 1145 |
| 16 | 336 | 757 | 3 | 0 | 3 | 1 | 0 | 1100 |
| 17 | 436 | 778 | 3 | 1 | 2 | 0 | 0 | 1220 |
| 18 | 299 | 2386 | 15 | 1 | 1 | 0 | 0 | 2702 |
| 19 | 709 | 988 | 11 | 0 | 3 | 0 | 0 | 1711 |
| 20 | 1188 | 2073 | 16 | 1 | 17 | 1 | 2 | 3298 |
| 21 | 910 | 629 | 12 | 0 | 2 | 0 | 0 | 1553 |
| 22 | 620 | 440 | 4 | 1 | 1 | 0 | 0 | 1066 |
| 23 | 300 | 32 | 0 | 1 | 0 | 0 | 2 | 335 |
| Total | 7200 | 26899 | 157 | 20 | 251 | 16 | 22 | 34565 |
| Percentage | 20.83 | 77.82 | 0.45 | 0.06 | 0.73 | 0.05 | 0.06 | 100 |
Despite being a country rich in water resources, Nepal faces an energy crisis in both urban and rural areas due to the inability to utilize these resources effectively. In the hilly and mountainous regions of Nepal, a large number of people still use wood/firewood/coal as cooking fuel, while the use of guitha (dried cow dung) is widespread in the Terai region.
Among the total households in this Nepalgunj Sub-Metropolitan City, 7,200 (20.83%) use wood/firewood/coal for cooking, while the majority, 26,899 (77.82%), use LP gas. Similarly, the number of families using electricity is 157 (0.45%), kerosene is 16 (0.05%), and bio gas is 251 (0.73%). Additionally, 20 households (0.06%) use guitha, and 22 households (0.06%) use other fuel sources. Detailed information is presented in the table.
Main Cooking Fuel Usage Distribution
Main Cooking Fuel Usage Distribution
Tap bars or slices to view details
According to the concept of sustainable development, it is essential to change human consumption patterns to maintain environmental balance. For example, Nepal aims to reduce the population using wood, firewood, cow dung, etc., as the primary source of fuel from 74.7% in the base year 2015 to 30% by 2030 (SDG-7), and increase the use of LP gas for cooking from 18% (2015) to 33%. Embracing this national goal, it is necessary to orient the policies and programs of this Sub-Metropolitan City towards it.
7.2.2 Households by Main Source of Lighting Fuel
The Nepal Electricity Authority (NEA) has been implementing plans for electricity maintenance, revenue collection, and electrification in all wards of this Sub-Metropolitan City. According to the National Census, 2021 (BS 2078), electricity appears to be the primary source of fuel used for lighting daily.
| Ward | Electricity | Solar | Kerosene | Bio Gas | Others | Total |
|---|---|---|---|---|---|---|
| 1 | 2108 | 54 | 3 | 0 | 2 | 2167 |
| 2 | 1356 | 6 | 0 | 0 | 1 | 1363 |
| 3 | 537 | 18 | 0 | 0 | 1 | 556 |
| 4 | 2874 | 27 | 1 | 0 | 16 | 2918 |
| 5 | 1112 | 20 | 5 | 0 | 0 | 1137 |
| 6 | 1382 | 14 | 11 | 1 | 3 | 1411 |
| 7 | 671 | 8 | 3 | 0 | 0 | 682 |
| 8 | 848 | 2 | 2 | 0 | 0 | 852 |
| 9 | 1418 | 5 | 1 | 0 | 1 | 1425 |
| 10 | 2644 | 13 | 1 | 0 | 5 | 2663 |
| 11 | 996 | 3 | 0 | 0 | 2 | 1001 |
| 12 | 1718 | 17 | 2 | 0 | 1 | 1738 |
| 13 | 1410 | 21 | 8 | 1 | 26 | 1466 |
| 14 | 1001 | 16 | 36 | 1 | 2 | 1056 |
| 15 | 980 | 8 | 146 | 5 | 6 | 1145 |
| 16 | 1064 | 10 | 24 | 1 | 1 | 1100 |
| 17 | 1182 | 21 | 16 | 0 | 1 | 1220 |
| 18 | 2681 | 16 | 2 | 0 | 3 | 2702 |
| 19 | 1651 | 11 | 37 | 3 | 9 | 1711 |
| 20 | 3214 | 31 | 46 | 3 | 4 | 3298 |
| 21 | 1484 | 8 | 49 | 3 | 9 | 1553 |
| 22 | 951 | 6 | 5 | 2 | 102 | 1066 |
| 23 | 302 | 2 | 19 | 0 | 12 | 335 |
| Total | 33584 | 345 | 417 | 20 | 199 | 34565 |
| Percentage | 97.16 | 1.00 | 1.21 | 0.06 | 0.58 | 100 |
Analyzing the source of fuel used by households for daily lighting in the Sub-Metropolitan City, it was found that out of a total of 34,565 households, 33,584 (97.16%) use electricity, 345 (1.00%) use solar, 417 (1.21%) use kerosene, 20 (0.06%) use bio gas, and 199 (0.58%) use other fuel sources. Detailed ward-wise information is presented in the table.
Details of Fuel Used for Daily Lighting
Details of Fuel Used for Daily Lighting
Tap bars or slices to view details
7.2.3 Households Using Alternative Energy
Increasing the use of renewable alternative energy while reducing dependence on petroleum products helps maintain environmental balance. Since products like diesel, petrol, and kerosene are not produced in Nepal, billions of rupees are spent annually on importing them. For a landlocked developing third-world country like Nepal, this is a major cause of trade deficit. In the context of our inability to effectively implement import substitution and export management policies, we can become self-reliant in energy sources through the development of wind energy, solar energy, hydro energy, and bio gas. Therefore, in Nepal's case, local, provincial, and federal governments must formulate necessary policies and work on the development of renewable alternative energy.
7.3 Communication and Technology
The globalized society of the 21st century is in the era of information and communication. While urban areas in Nepal have largely embraced the revolution in information and communication, rural areas still lack full expansion of television, newspapers, internet, telephone, mobile, and courier services. Developing these media of communication and technology to bring rural populations into the world of information and communication remains a challenge. The Constitution of Nepal defines the people's right to information as a fundamental right. The details of communication and technology available in Nepalgunj Sub-Metropolitan City are as follows. Communication media operate via NCELL and NTC, and internet services have expanded through various internet companies. Currently, the Sub-Metropolitan City has introduced policies and programs to make service delivery information and technology-friendly, integrate all currently used software into a single organized web portal, install CCTV cameras in high-traffic areas, and conduct activities like capacity development training, workshops, orientations, and writing improvement for local media and journalists. Radio, FM, and communication media in the Sub-Metropolitan City are presented in the table below.
7.3.1 Details of Radio, FM and Communication Media in the Sub-Metropolitan City
| S.N. | Entity | Station Manager | Contact Number |
|---|---|---|---|
| 1 | Bageshwari FM | Shukrarishi Chaulagai | 9858024709 |
| 2 | Krishnasar FM | Tula Adhikari | 9851074280 |
| 3 | Rubaru FM | Shakil Ahmed Qadri | 9858066768 |
| 4 | Radio Sadbhav FM | Navin Giri | 9848082228 |
| 5 | Radio Morning Star FM | Datta Dhital | 9858020842 |
| 6 | Radio Hatemalo FM | Dilli B.C. | 9858021099 |
| 7 | Bheri FM | Arif Ansari | 9858023997 |
| 8 | Nepal Television Correspondent | Rudra Subedi | 9858021181 |
| 9 | Kantipur Television Correspondent | J. Pandey, Sabita G.C. | 9858020565 |
| 10 | Kantipur Daily Correspondent | Rupa Gahatraj | 9848027792 |
| 11 | Image Television Correspondent | Narendra Thapa | 9848023663 |
| 12 | Himalaya Television Correspondent | Krishna Adhikari | 9858023161 |
| 13 | News 24 Television Correspondent | Krishna Khanal | 9851021088 |
| 14 | Avenues Television Correspondent | Durga Rokaya | 9858023665 |
| 15 | Bageshwari Television Correspondent | Priyasmriti Dhakal | 9848152324 |
| 16 | Kohalpur Television Correspondent | Rudra Subedi | 9858021181 |
| 17 | Rastriya Samachar Samiti | Yuv Raj Pandey | 9857025057 |
| 18 | Gorkhapatra/Kalprishtha Daily Editor | Kamal Khatri | 9851148361 |
| 19 | Dainik Nepalgunj Correspondent | Jhalak Gaire | 9858020711 |
| 20 | Mission Today | Binod Paudel | 9858023069 |
| 21 | Naya Patrika Daily Correspondent | Bishwaraj Pachhaldawa | 9848032299 |
| 22 | AP1 Television Correspondent | Laxman Dhungana | 9858024565 |
| 23 | BBC Nepali Service | Bimala Chaudhary | 9848002213 |
7.3.2 Details on Access to Modern Facilities
| Ward No. | No Facility | At Least One Facility | Radio | Television | Landline | Mobile (Basic) | Smart Mobile | Computer/Laptop | Internet | Car/Jeep/Van | Motorcycle | Bicycle | Electric Fan | Refrigerator | Washing Machine | AC |
|---|---|---|---|---|---|---|---|---|---|---|---|---|---|---|---|---|
| 1 | 42 | 2125 | 866 | 1377 | 110 | 1500 | 1886 | 544 | 1368 | 82 | 911 | 1045 | 1884 | 1099 | 172 | 132 |
| 2 | 34 | 1329 | 536 | 1045 | 213 | 1017 | 1201 | 410 | 1043 | 100 | 735 | 559 | 1223 | 778 | 170 | 123 |
| 3 | 11 | 545 | 192 | 377 | 67 | 341 | 420 | 100 | 258 | 8 | 272 | 271 | 451 | 300 | 130 | 73 |
| 4 | 39 | 2879 | 1204 | 1823 | 235 | 2023 | 2552 | 833 | 2031 | 161 | 1283 | 974 | 2402 | 1764 | 266 | 222 |
| 5 | 31 | 1106 | 164 | 744 | 59 | 798 | 929 | 144 | 333 | 27 | 430 | 696 | 945 | 423 | 85 | 72 |
| 6 | 29 | 1382 | 357 | 866 | 70 | 927 | 1136 | 222 | 775 | 36 | 610 | 778 | 1270 | 640 | 48 | 42 |
| 7 | 3 | 679 | 227 | 509 | 42 | 284 | 518 | 67 | 303 | 7 | 279 | 385 | 637 | 356 | 67 | 48 |
| 8 | 28 | 824 | 65 | 631 | 11 | 543 | 718 | 96 | 365 | 11 | 426 | 606 | 792 | 503 | 102 | 44 |
| 9 | 24 | 1401 | 784 | 831 | 149 | 831 | 1169 | 334 | 900 | 28 | 539 | 751 | 1314 | 651 | 37 | 32 |
| 10 | 19 | 2644 | 1733 | 1619 | 439 | 1485 | 2429 | 1013 | 2052 | 183 | 1232 | 958 | 2412 | 1392 | 317 | 208 |
| 11 | 5 | 996 | 629 | 825 | 234 | 727 | 865 | 189 | 716 | 37 | 433 | 591 | 917 | 603 | 160 | 87 |
| 12 | 35 | 1703 | 556 | 1152 | 172 | 982 | 1462 | 484 | 1144 | 71 | 759 | 776 | 1545 | 1011 | 140 | 112 |
| 13 | 105 | 1361 | 369 | 648 | 162 | 796 | 911 | 234 | 372 | 48 | 472 | 913 | 1025 | 359 | 62 | 42 |
| 14 | 43 | 1013 | 17 | 275 | 3 | 556 | 457 | 21 | 88 | 4 | 175 | 911 | 876 | 121 | 6 | 2 |
| 15 | 78 | 1067 | 13 | 378 | 3 | 570 | 627 | 20 | 69 | 4 | 245 | 677 | 831 | 134 | 30 | 10 |
| 16 | 30 | 1070 | 361 | 471 | 7 | 807 | 725 | 37 | 103 | 11 | 292 | 911 | 974 | 261 | 74 | 14 |
| 17 | 53 | 1167 | 587 | 701 | 54 | 860 | 825 | 152 | 522 | 40 | 396 | 922 | 996 | 265 | 40 | 19 |
| 18 | 153 | 2549 | 760 | 1797 | 236 | 1516 | 2142 | 872 | 1641 | 154 | 1382 | 1245 | 2234 | 1491 | 150 | 124 |
| 19 | 65 | 1646 | 82 | 911 | 29 | 1053 | 1166 | 138 | 531 | 32 | 596 | 1269 | 1494 | 594 | 38 | 13 |
| 20 | 165 | 3133 | 322 | 1649 | 90 | 2350 | 2047 | 316 | 1163 | 55 | 908 | 1667 | 2612 | 852 | 39 | 32 |
| 21 | 84 | 1469 | 99 | 388 | 15 | 882 | 680 | 56 | 269 | 9 | 298 | 1337 | 1249 | 166 | 8 | 9 |
| 22 | 80 | 986 | 50 | 414 | 16 | 716 | 518 | 51 | 216 | 10 | 211 | 888 | 813 | 221 | 11 | 9 |
| 23 | 14 | 321 | 5 | 68 | 0 | 198 | 144 | 6 | 73 | 3 | 84 | 282 | 259 | 55 | 7 | 1 |
| Total | 1170 | 33395 | 9978 | 19539 | 2576 | 21842 | 25535 | 6347 | 16335 | 1129 | 13049 | 19412 | 29155 | 14247 | 2181 | 1470 |
Based on resources and service facilities, it appears that the number of households with at least one facility in the Sub-Metropolitan City is 33,395. Among the total households, 29,155 households have electric fans, and 25,535 households have smart mobile phones. Similarly, the number of families with basic mobile phones is 21,842. The number of families with radio facilities is 9,978, while 19,539 families have televisions.
Overall, the data shows an increase in mobile services in the communication sector, while internet services are also in the process of expansion. Since mobile users can easily perform many tasks such as audio, video, information, music, and news exchange, the number of television and radio users is decreasing compared to mobile users. Due to the geographical condition, being entirely in the Terai region and flat land, the number of people using high-facility items like cars/jeeps, air conditioners, heaters, or gas geysers is increasing. Detailed ward-wise information is presented in the table.
Details of Resources and Facilities in the Family
Details of Resources and Facilities in the Family
Tap bars or slices to view details
7.4 Housing and Buildings
The Sub-Metropolitan City has settlements with mixed population density. In terms of establishing settlements, there is a tradition of living scattered in potential market areas, water-available zones, cultivable areas, and locations suitable for animal husbandry and food production. Consequently, settlements are thick in some wards and thin in others. Most houses here are permanent (pakki) or semi-permanent (ardha-pakki), making the houses in this Sub-Metropolitan City relatively safe and risk-free from earthquakes and other disasters from a security perspective.
7.4.1 Households Based on Type of Roof
| Ward | Zinc/Tin | Cement/Concrete | Thatch/Straw | Tiles | Stone/Slate | Wood/Plank | Others | Total |
|---|---|---|---|---|---|---|---|---|
| 1 | 157 | 1940 | 9 | 10 | 48 | 3 | 0 | 2167 |
| 2 | 119 | 1208 | 4 | 10 | 17 | 3 | 2 | 1363 |
| 3 | 71 | 475 | 2 | 3 | 4 | 1 | 0 | 556 |
| 4 | 232 | 2624 | 5 | 4 | 14 | 17 | 22 | 2918 |
| 5 | 170 | 954 | 2 | 8 | 2 | 1 | 0 | 1137 |
| 6 | 218 | 1126 | 14 | 44 | 5 | 1 | 3 | 1411 |
| 7 | 59 | 602 | 3 | 9 | 2 | 7 | 0 | 682 |
| 8 | 84 | 746 | 10 | 1 | 8 | 2 | 1 | 852 |
| 9 | 92 | 1253 | 11 | 65 | 2 | 2 | 0 | 1425 |
| 10 | 127 | 2496 | 14 | 11 | 5 | 6 | 5 | 2663 |
| 11 | 121 | 851 | 9 | 0 | 9 | 11 | 0 | 1001 |
| 12 | 174 | 1532 | 6 | 19 | 6 | 0 | 1 | 1738 |
| 13 | 460 | 885 | 32 | 83 | 3 | 3 | 0 | 1466 |
| 14 | 396 | 475 | 62 | 120 | 2 | 0 | 1 | 1056 |
| 15 | 349 | 527 | 85 | 175 | 4 | 2 | 3 | 1145 |
| 16 | 324 | 712 | 16 | 31 | 4 | 13 | 0 | 1100 |
| 17 | 322 | 809 | 12 | 75 | 1 | 1 | 0 | 1220 |
| 18 | 326 | 2319 | 14 | 33 | 8 | 2 | 0 | 2702 |
| 19 | 551 | 1091 | 21 | 39 | 3 | 0 | 6 | 1711 |
| 20 | 1154 | 1966 | 49 | 110 | 16 | 1 | 2 | 3298 |
| 21 | 622 | 768 | 38 | 118 | 6 | 0 | 1 | 1553 |
| 22 | 393 | 559 | 59 | 43 | 7 | 1 | 4 | 1066 |
| 23 | 155 | 98 | 55 | 26 | 0 | 0 | 1 | 335 |
| Total | 6676 | 26016 | 532 | 1037 | 176 | 77 | 51 | 34565 |
| Percentage | 19.31 | 75.27 | 1.54 | 3.00 | 0.51 | 0.22 | 0.15 | 100 |
Households Based on Type of Roof
Households Based on Type of Roof
Tap bars or slices to view details
Out of the total 34,565 households in this city, the highest number of families live in houses with cement/concrete roofs, totaling 26,016 (75.27%). Similarly, 6,676 (19.31%) households have zinc/tin roofs, 1,037 (3%) have tiled roofs, 532 (1.54%) have thatch/straw roofs, and 176 (0.51%) have stone/slate roofs. Additionally, 77 (0.22%) households are found to have wood/plank roofs, while 51 (0.15%) have other types of roofing.
7.4.2 Details regarding Government Buildings
Local levels need to construct municipality office buildings, ward office buildings, and other essential government buildings on their own land or land received from the Government of Nepal. This makes performance efficient and effective, giving the people a sense of the government's presence. Once such permanent structures are built, federalism takes institutional form.
According to the belief that local government programs should be operated by constructing necessary physical structures in local levels formed under the federal governance system, it is necessary for rural municipalities/municipalities to have their own community buildings and assembly halls. Currently, the details of community buildings and assembly halls in the Sub-Metropolitan City are included in the table below.
| S.N. | Name of Government and Community Building | Ward No. | Current Status | Remarks |
|---|---|---|---|---|
| 1 | Dharamshala | 1 | ||
| 2 | Community Building | 2 | ||
| 3 | Musafir Khana | 3 Eklaini | ||
| 4 | Dharamshala | 3 Triveni Mod | ||
| 5 | Kaunilal Dharamshala | 8 | ||
| 6 | Community Building | Bhrikutinagar 10 | ||
| 7 | Senior Citizen Meeting Center | 12 | ||
| 8 | Lolenpur Dharamshala | 13 | ||
| 9 | Mahaparwa Dharamshala | 13 | ||
| 10 | City Hall (Nagar Bhawan) | 14 | ||
| 11 | Durga Dharamshala | 20, Manikapur | ||
| 12 | Yadav Dharamshala | 20, Rameshpur | ||
| 13 | Pashupati Temple Dharamshala | 20, Samjhanachowk | ||
| 14 | Gaushala | 21 | ||
| 15 | Yoga Hall | 22 | ||
| 16 | Ward Office | 23 |
7.4.3 Details of Slaughterhouse
If the local government works by placing public health at a high priority, healthy and positive-thinking citizens can be produced who can contribute to development, construction, and services. Therefore, it is desirable to construct clean slaughterhouses equipped with modern technology, ensuring people's right to food security, and developing and implementing policies that require specific standards to be met before slaughtering meat animals and birds. Systematic slaughterhouses are not in operation within Nepalgunj Sub-Metropolitan City. Animals are slaughtered in fresh houses and open spaces.
7.4.4 Details of Cremation Ground
In Nepal, the tradition of performing death rituals according to religious traditions has been going on since ancient times. The management of cremation grounds and burial sites (samadhisthals) according to the religion and culture of each community and municipality is an important and sensitive issue and necessity. This topic, which also carries emotional significance, should be addressed in a timely manner by any plan. Otherwise, unmanaged cremations would add a challenge to the city's environmental, social, and cultural system. Cremation grounds and burial sites that have been traditionally operated must be made convenient and systematic in the future. Currently, the details of cremation grounds and burial sites in operation within the Sub-Metropolitan City are included in the table below.
| S.N. | Name of Cremation Ground / Burial Site / Cemetery | Address | Caste/Community |
|---|---|---|---|
| 1 | Masanghat | Ward No. 8 | Hindu (Cremation) |
| 2 | Lodhai Village, Bulbulia Cremation Ground | Ward No. 13 | Hindu (Cremation) |
| 3 | Matanpurwa, Balegaon, Babugaon, Kairatipurwa, Gasarhipurwa (Cremation Ground) | Ward No. 14 | Hindu (Cremation) |
| 4 | Baikunthadham Masanghat | Ward No. 15 | Hindu (Cremation) |
| 5 | Dihiwa Cremation Ground | Ward No. 16 | Hindu |
| 6 | Cemeteries in various locations | Ward No. 17 | Muslim |
| 7 | Khaskadhoko Cemetery | Ward No. 18 | Muslim |
| 8 | Gayatri Nagar, Nayabasti, Duduwa Cremation Ground, Manikapur Cemetery | Ward No. 20 | Hindu/Muslim |
| 9 | Pitti Baldev Nagar | Ward No. 21 | |
| 10 | Cemetery near Maharaja Religious School, East of Birta, and Cemetery near Maharaja School | Ward No. 22 | Muslim |
| 11 | Bhajjapurwa, Jangalipurwa Cemetery | Ward No. 23 | Muslim |
Institutional and Governance Status
Organizational structure, services, and laws & policies
8.1 Organizational and Human Resource Status
8.1.1 Organizational Structure of the Sub-Metropolitan City: Proposed Organization Chart as in the Organizational Survey
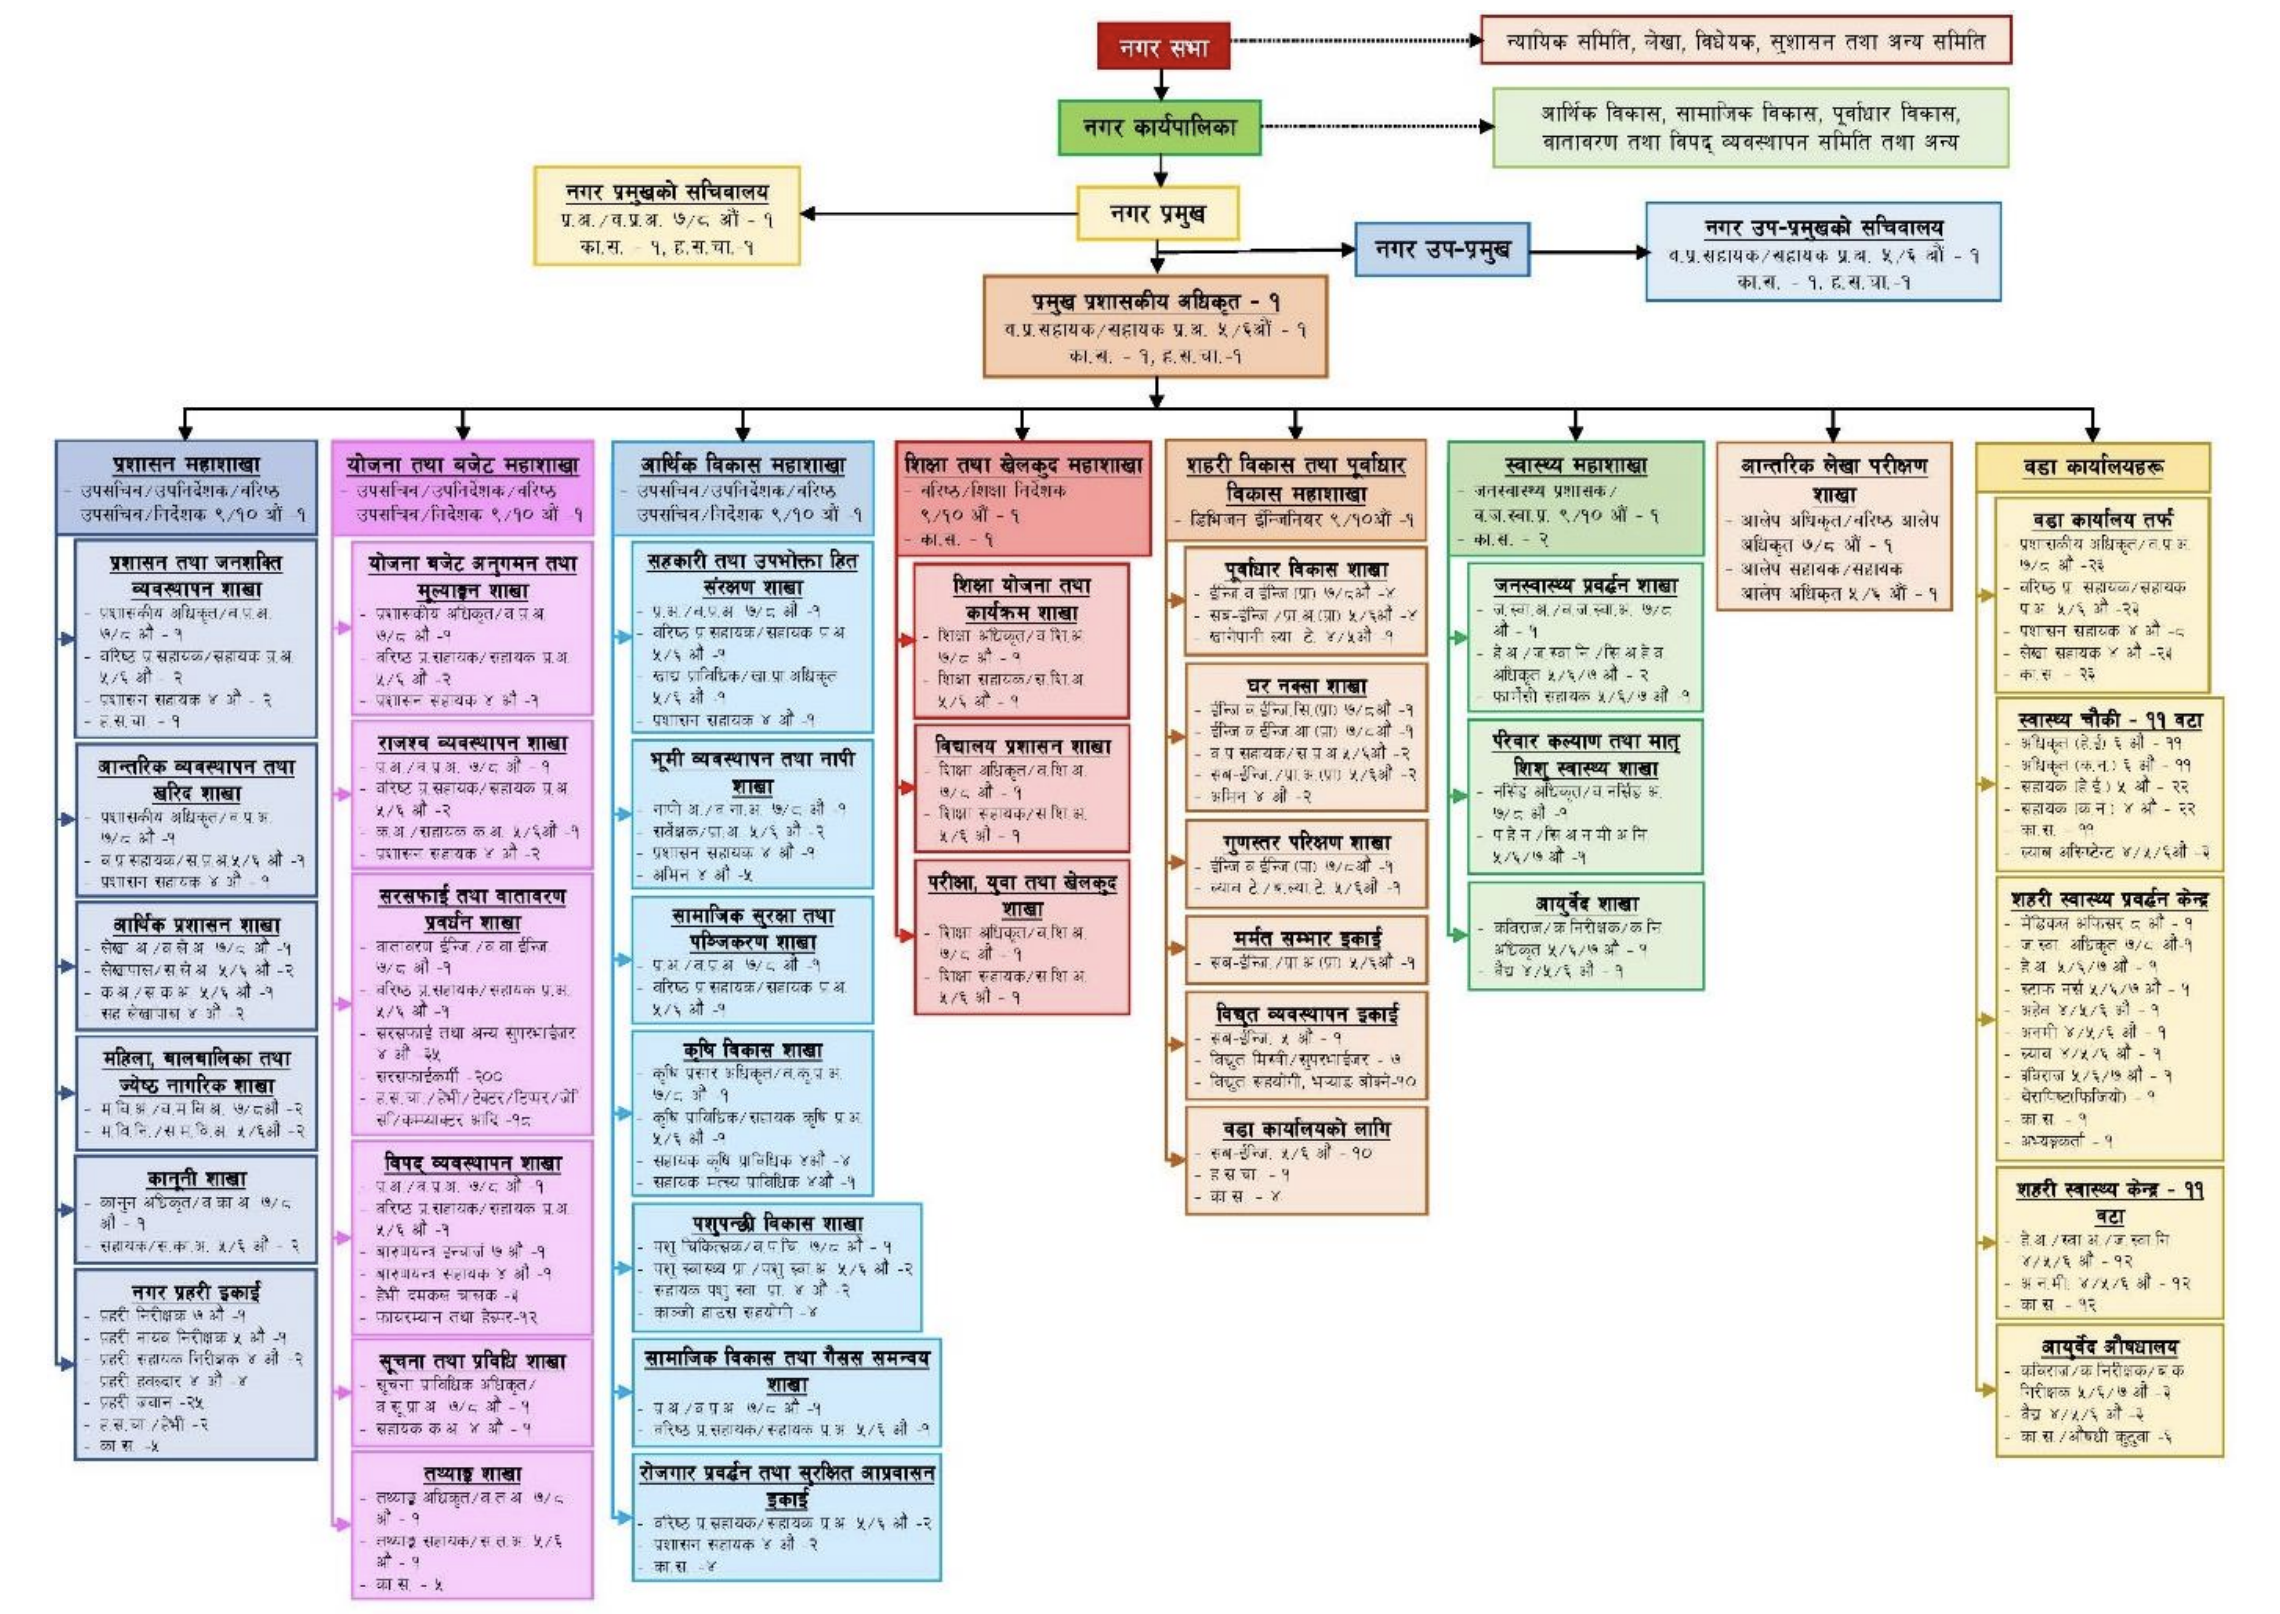
Organizational Structure of the Sub-Metropolitan City
8.2 Service Operation and Management
8.2.1 Types of Available Services
Disability ID card distribution and update,
Free treatment recommendation,
Agriculture group registration, renewal, and cancellation,
Distribution of agricultural machinery, medicine, veterinary treatment, and equipment,
Crop and livestock insurance,
Private firm registration, renewal, and cancellation,
Business registration, renewal, and cancellation,
Cooperative registration and cancellation,
Organization registration and cancellation,
Employment counseling,
Personal incident registration,
Registration and renewal of new social security allowance beneficiaries,
Distribution and renewal of Class 'D' construction entrepreneur license,
House construction permit,
House map approval and documentation,
Dispute resolution and mediation,
Scholarship recommendation,
Permission for school operation and additional classrooms,
Training operation,
Various recommendation and certification tasks from sub-metropolitan and ward offices, etc.
8.2.2 Service Flow Process and Feedback
Distribution of Disability and Senior Citizen ID Cards
Based on the application of the concerned person, recommendation of the ward, and in case of need, based on the recommendation of a specialist doctor, the Disability ID Card Distribution Committee distributes the ID card after investigation.
If an application is submitted along with a copy of the citizenship certificate for a senior citizen ID card, the ID card will be distributed after investigation.
Club Registration
If an application is submitted by attaching the constitution, meeting decisions, and other necessary documents of Child Clubs, Girl Clubs, Youth Clubs, and networks, registration will be done if found appropriate after necessary investigation, and renewal and cancellation will be carried out according to the rules.
Free Treatment Recommendation
Based on the application of the concerned person, hospital referral slip, and ward recommendation, recommendations for free treatment will be made based on the Free Treatment Recommendation Committee.
Agricultural Group Registration
After the application is submitted along with the decision copy of the proposed group and citizenship certificates, the Agriculture and Livestock Service Sub-section will perform the necessary investigation and register the agricultural group, and renewal and cancellation will be carried out according to the rules.
Distribution of Agricultural Machinery, Medicine, Veterinary Treatment, and Equipment
Based on the annual program, demand of the target group, and application, agricultural machinery and livestock treatment equipment will be distributed. Treatment services from the service centers will be available free of charge.
Crop and Livestock Insurance
The Sub-Metropolitan City will provide subsidized crop and livestock insurance for interested individuals.
Business Registration
If an interested applicant submits the ward recommendation, copy of land ownership certificate, copy of Nepali citizenship certificate, and application, business registration and its renewal and cancellation will be carried out according to the rules.
Cooperative Registration
If copies of meeting decisions with bylaws, copies of citizenship certificates, and other necessary documents are attached and submitted, registration of the cooperative society will be done if found appropriate after necessary investigation; merger, division, and cancellation of registration will be carried out according to the rules.
Local Organization Registration
If an application is submitted by attaching the constitution, copies of meeting decisions, copies of citizenship certificates, and other necessary documents, registration of the organization will be done if found appropriate after necessary investigation, and renewal and cancellation will be carried out according to the rules.
Employment Counseling
Counseling work will be carried out from the Employment Service Center for individuals wishing to go for foreign employment.
Labor Permit
In order to obtain an individual labor permit, if documents such as the visa provided by the employer company, agreement documents, etc. are attached and submitted, the work of its approval will be advanced through online media and after the approval is received, the approval letter will be printed and provided.
When individuals returning from foreign employment on leave start going back to foreign employment, if documents such as the visa provided by the employer company, agreement documents, etc. are attached and submitted for re-labor permit, the work of its re-approval will be advanced through online media and after the approval is received, the approval letter will be printed and provided.
Foreign Employment Assistance
If an application is submitted by attaching ward recommendation and other necessary documents for tasks such as death and disability compensation provided through the Foreign Employment Board, family health treatment expenses, bringing the body home in case of death, rescue and search of those stranded abroad, service will be provided by advancing the necessary process.
Personal Incident Registration
Based on the information form provided by the informant and other necessary documents, the local registrar will investigate and perform online personal incident registration and provide the registration certificate.
Registration and Renewal of New Beneficiaries of Social Security Allowance
For senior citizens, senior citizen single women, disabled, widows, Dalit children's nutrition allowance, and endangered citizens, if an application is submitted by filling out the form along with necessary documents at the ward office to be registered as a new beneficiary for social security allowance, there is a provision for receiving the allowance from the next month after being registered as a new beneficiary if found eligible after investigation.
For individuals already registered in social security allowance, there is a provision for carrying out renewal and updating data if an application is submitted by filling out the form along with documents within the month of Bhadra every year.
Distribution of Class 'D' Construction Entrepreneur License
If an application is submitted by attaching details of necessary manpower and machinery equipment and copies of certificates, copies of citizenship certificates, the license will be provided as per the decision of the executive after necessary investigation, and renewal and cancellation will be carried out according to the rules.
House Construction Permission, House Map Approval, and Documentation
If an application is submitted along with the copy of citizenship certificate for house map approval including the drawing design of the house to be built, house map approval will be done after completing the necessary investigation and process, and house construction permission will be granted on that basis.
In the case of old houses, if an application is submitted along with the map of the built house and copy of citizenship certificate, a documentation certificate will be provided after completing the necessary investigation and process.
Dispute Resolution and Mediation
The local Judicial Committee will carry out the work of adjudication and mediation on various issues within its jurisdiction.
Scholarship Recommendation
If an application is submitted along with the ward recommendation for free study, a recommendation for scholarship will be made after necessary investigation.
School Operation and Additional Classroom Permission
If an application is submitted by attaching other necessary documents after completing the necessary infrastructure for school operation or classroom addition, permission for school operation will be granted if found appropriate after necessary investigation.
Training Operation
Various income-generating and skill-based trainings are conducted through the Sub-Metropolitan City's own annual plan/program, and such trainings are also being conducted in coordination and collaboration with various non-governmental organizations.
Various Recommendation and Certification Tasks from Sub-Metropolitan and Ward Offices
If an application is submitted to the Sub-Metropolitan or ward along with necessary documents for tasks as prescribed by the Local Government Operation Act, 2074, which are within the jurisdiction of the local level, recommendation and certification tasks will be carried out according to the rules.
8.3 Laws, Policies and Procedures
8.3.1 Approved Laws, Policies, Rules, Guidelines, and Standards of the Sub-Metropolitan City
| S.N. | Approved Laws, Policies, Rules, Guidelines, and Standards by the Sub-Metropolitan City |
|---|---|
| 1. | Gender Violence Prevention Strategy and Child Marriage Abolition Action Plan, 2075 |
| 2. | Child Protection Policy, 2075 |
| 3. | Standards for Relief to Workers and Vulnerable Persons in Informal Sectors, 2076 |
| 4. | Procurement Standards for Sanitary Pads for Girls in Community Schools, 2081 |
| 5. | Cooperative Act, 2074 |
| 6. | Waste Management Act, 2075 |
| 7. | Disaster Risk Reduction and Management Act, 2075 |
| 8. | Nepalgunj (Economic Act), 2076 |
| 9. | Appropriation Act, 2075 |
| 10. | Economic Act, 2077 |
| 11. | Nepalgunj Sub-Metropolitan City Children's Act, 2077 |
| 12. | Rights of Persons with Disabilities Act, 2077 |
| 13. | Economic Act, 2078 |
| 14. | Good Governance Act, 2078 |
| 15. | Employee Adjustment Act, 2078 |
| 16. | Economic Act, 2080 |
| 17. | Economic Act, 2081 |
| 18. | Income Management and Regulation Act, 2081 |
| 19. | City Police Act (Second Amendment), 2081 |
| 20. | Economic Act, 2082 |
| 21. | Act to Establish and Operate Maintenance Fund, 2082 |
| 22. | Appropriation Act, 2082 |
| 23. | City Bus Operation and Management Procedure, 2075 |
| 24. | City Assembly Formation Regulation, 2075 |
| 25. | Public Procurement Regulation, 2077 |
| 26. | City Police Operation and Management Procedure, 2075 |
| 27. | Child Club Formation and Operation Procedure, 2075 |
| 28. | Disability ID Card Distribution Procedure, 2075 |
| 29. | Management and Identification of Persons with Disabilities Procedure, 2075 |
| 30. | Fire Engine Operation and Management Procedure, 2075 |
| 31. | Child Fund Operation Procedure, 2075 |
| 32. | Protection and Promotion of Children's Rights Procedure, 2075 |
| 33. | Local Health Institution Operation and Management Procedure, 2075 |
| 34. | Gender Violence Prevention Fund Operation Procedure, 2075 |
| 35. | Disaster Management Fund Procedure, 2076 |
| 36. | Introduction, Purpose, and Implementation of Women's Development Program Procedure, 2076 |
| 37. | Senior Citizen Service and Meeting Center Operation and Management Procedure, 2077 |
| 38. | Basic Level (Class-8) Student Evaluation and Result Publication Procedure, 2078 |
| 39. | Girl Education and Child Marriage Reduction Fixed Deposit Scheme Procedure, 2078 |
| 40. | E-Rickshaw Operation Management and Regulation Procedure, 2078 |
| 41. | Women's Club Operation Rules and Procedure, 2078 |
| 42. | Land Delineation Procedure, 2078 |
| 43. | Disaster Relief Distribution Standards, 2078 |
| 44. | Adolescent Development Program Operation Procedure, 2078 |
| 45. | Tole Level Organization Formation and Operation Procedure, 2078 |
| 46. | Men's Network Formation and Operation for Ending Gender Violence Procedure, 2078 |
| 47. | Gender Equality Policy and Implementation Procedure, 2078 |
| 48. | Nepalgunj Sub-Metropolitan City Senior Citizen Club Operation and Formation Procedure, 2078 |
| 49. | Emergency Operation Procedure, 2079 |
| 50. | Nepalgunj Sub-Metropolitan City Senior Citizen Club Operation and Formation Procedure, 2079 |
| 51. | Disaster Risk Insurance Procedure, 2080 |
| 52. | Business Continuity Plan, 2080 |
| 53. | Local Government Operation with the Poor Procedure, 2080 |
| 54. | Youth Club Formation and Mobilization Procedure, 2080 |
| 55. | Disability Rights Promotion Fund Procedure, 2080 |
| 56. | Horse Stable and Kasgar Welfare Secure Housing Program Operation Procedure, 2080 |
| 57. | Dowry System Prevention and Eradication Procedure, 2081 |
| 58. | Guidelines for Protection and Promotion of Rights of Persons with Disabilities, 2075 |
| 59. | Accounting Guidelines for Ward Offices, 2076 |
| 60. | Health Institution Registration Permission and Renewal Guidelines, 2076 |
| 61. | City Bus Operation and Management Guidelines, 2076 |
| 62. | Mediation Guidelines, 2076 |
| 63. | Nepalgunj Sub-Metropolitan City Ward Office Bookkeeping Guidelines, 2076 |
| 64. | Referral System for Gender Violence Addressing Guidelines, 2076 |
| 65. | Mediation Guidelines, 2076 |
| 66. | Public Procurement Regulation, 2077 |
| 67. | Child Marriage Free Campaign Operation Guidelines, 2078 |
| 68. | Child-Friendly Local Governance Implementation Guidelines, 2078 |
| 69. | Minimum Standards and Monitoring Guidelines for Rights and Dignity of Workers in Entertainment and Hospitality Sectors in Nepalgunj Sub-Metropolitan City, 2078 |
| 70. | Farmer Group Formation and Management Guidelines, 2079 |
| 71. | City Disaster Management Volunteer Mobilization Guidelines, 2080 |
| 72. | Child Protection Policy, 2075 |
| 73. | Nepalgunj Sub-Metropolitan City Mass Communication Policy, 2078 |
| 74. | Policy on Citizen Participation in Public Financial Management, 2080 |
| 75. | Occupational Safety and Health Policy Roadmap for Sanitation Workers, 2081 |
8.3.2 Details of Municipal Executive Manpower
| S.N. | Division/Section Name | Post | Level | Service/Group | Approved Position |
|---|---|---|---|---|---|
| 1. | Chief Administrative Officer | Joint Secretary | Admin/ General Admin | 1 | |
| 2. | City Mayor's Secretariat | Administrative Officer/ Sr. Admin Officer | 7/8th | Admin/ General Admin | 1 |
| 3. | Deputy City Mayor's Secretariat | Senior Admin Assistant/ Assistant Admin Officer | 5/6th | Admin/ General Admin | 1 |
| 4. | Chief Administrative Officer's Secretariat | Senior Admin Assistant/ Assistant Admin Officer | 5/6th | Admin/ General Admin | 1 |
| 5. | Office Helper | 3 | |||
| 6. | Driver | 3 | |||
| Total | 10 | ||||
| 1. | Administration Division | Under Secretary/ Deputy Director/ Sr. Under Secretary/ Director | 9/10th | Admin/ General Admin | 1 |
| 1.1 | Administration and Human Resource Management Section | Administrative Officer/ Sr. Admin Officer | 7/8th | Admin/ General Admin | 1 |
| Senior Admin Assistant/ Assistant Admin Officer | 5/6th | Admin/ General Admin | 2 | ||
| Administration Assistant | 4th | Admin/ General Admin | 2 | ||
| Driver | 1 | ||||
| 1.2 | Internal Management and Procurement Section | Administrative Officer/ Sr. Admin Officer | 7/8th | Admin/ General Admin | 1 |
| Senior Admin Assistant/ Assistant Admin Officer | 5/6th | Admin/ General Admin | 1 | ||
| Administration Assistant | 4th | Admin/ General Admin | 1 | ||
| 1.3 | Financial Administration Section | Accounting Officer/ Sr. Accounting Officer | 7/8th | Admin/ Accounting | 1 |
| Accountant/ Assistant Accounting Officer | 5/6th | Admin/ Accounting | 2 | ||
| Computer Assistant/ Assistant Computer Officer | 5/6th | Admin/ Miscellaneous | 1 | ||
| Co-Accountant | 4th | Admin/ Accounting | 2 | ||
| 1.4 | Women, Children and Senior Citizen Section | Women Development Officer/ Sr. Women Dev Officer | 7/8th | Admin/ Miscellaneous | 2 |
| Women Development Inspector/ Assistant Women Dev Officer | 5/6th | Admin/ Miscellaneous | 2 | ||
| 1.5 | Law Section | Law Officer/ Sr. Law Officer | 7/8th | Admin/ Law | 1 |
| Assistant Assistant/ Assistant Law Officer | 5/6th | Admin/ Law | 2 | ||
| 1.6 | City Police Section | Police Inspector | 7th | 1 | |
| Deputy Police Inspector | 5th | 1 | |||
| Assistant Police Inspector | 4th | 1 | |||
| Police Havildar | 3rd | 4 | |||
| Police Constable | 25 | ||||
| Driver/Heavy | 2 | ||||
| Office Helper (Total) | 5 | ||||
| Total | 62 | ||||
| 2. | Planning and Budget Division | Under Secretary/ Deputy Director/ Sr. Under Secretary/ Director | 9/10th | Admin/ General Admin | 1 |
| 2.1 | Planning Budget Monitoring and Evaluation Section | Administrative Officer/ Sr. Admin Officer | 7/8th | Admin/ General Admin | 1 |
| Senior Admin Assistant/ Assistant Admin Officer | 5/6th | Admin/ General Admin | 2 | ||
| Administration Assistant | 4th | Admin/ General Admin | 1 | ||
| 2.2 | Revenue Management Section | Administrative Officer/ Sr. Admin Officer | 7/8th | Admin/ General Admin | 1 |
| Senior Admin Assistant/ Assistant Admin Officer | 5/6th | Admin/ General Admin | 2 | ||
| Computer Assistant/ Assistant Computer Officer | 5/6th | Admin/ Miscellaneous | 1 | ||
| Administration Assistant | 4th | Admin/ General Admin | 2 | ||
| 2.3 | Sanitation and Environment Promotion Section | Environment Engineer/ Sr. Env Engineer | 7/8th | Admin/ Miscellaneous | 1 |
| Senior Admin Assistant/ Assistant Admin Officer | 5/6th | Admin/ General Admin | 1 | ||
| Sanitation and Other Supervisor | 4th | 35 | |||
| Sanitation Worker | 200 | ||||
| Driver/Heavy/Tractor/ Tipper/JCB/Compactor etc | 18 | ||||
| 2.4 | Disaster Management Section | Administrative Officer/ Sr. Admin Officer | 7/8th | Admin/ General Admin | 1 |
| Senior Admin Assistant/ Assistant Admin Officer | 5/6th | Admin/ General Admin | 1 | ||
| Fire Engine In-charge | 7th | 1 | |||
| Fire Engine Assistant | 4th | 1 | |||
| Heavy Fire Engine Driver | 3 | ||||
| Fireman and Helper | 12 | ||||
| 2.5 | Information and Technology Section | Information Technology Officer/ Sr. IT Officer | 7/8th | Information Technology | 1 |
| Assistant Computer Operator | 4th | Admin/ Miscellaneous | 1 | ||
| 2.6 | Statistics Section | Statistics Officer/ Sr. Stat Officer | 7/8th | Admin/ Statistics | 1 |
| Statistics Assistant/ Assistant Stat Officer | 5/6th | Admin/ Statistics | 1 | ||
| Office Helper | 5 | ||||
| Total | 294 | ||||
| 3. | Economic Development Division | Under Secretary/ Deputy Director/ Sr. Under Secretary/ Director | 9/10th | Admin/ General Admin | 1 |
| 3.1 | Cooperative and Consumer Interest Protection Section | Administrative Officer/ Sr. Admin Officer | 7/8th | Admin/ General Admin | 1 |
| Senior Admin Assistant/ Assistant Admin Officer | 5/6th | Admin/ General Admin | 1 | ||
| Food Technician/ Food Tech Officer | 5/6th | Agriculture/ Food Nutri Controller | 1 | ||
| Administration Assistant | 4th | Admin/ General Admin | 1 | ||
| 3.2 | Land Management and Survey Section | Survey Officer/ Sr. Survey Officer | 7/8th | Engi./Survey | 1 |
| Surveyor/Technical Officer | 5/6th | Engi./Survey | 2 | ||
| Administration Assistant | 4th | Admin/ General Admin | 1 | ||
| Amin | 4th | Engi./Survey | 5 | ||
| 3.3 | Social Security and Registration Section | Administrative Officer/ Sr. Admin Officer | 7/8th | Admin/ General Admin | 1 |
| Senior Admin Assistant/ Assistant Admin Officer | 5/6th | Admin/ General Admin | 1 | ||
| 3.4 | Agriculture Development Section | Agriculture Extension Officer/ Sr. Agri Extension Officer | 7/8th | Agriculture/Agri Extension | 1 |
| Agriculture Technician/ Assistant Agri Extension Officer | 5/6th | Agriculture/Agri Extension | 1 | ||
| Assistant Agriculture Technician | 4th | Agriculture/Agri Extension | 4 | ||
| Assistant Fishery Technician | 4th | Agriculture/Fishery | 1 | ||
| 3.5 | Livestock Development Section | Veterinary Doctor/ Sr. Vet Doctor | 7/8th | Agriculture/ Veterinary | 1 |
| Livestock Health Technician/ Officer | 5/6th | Agriculture/ Veterinary | 2 | ||
| Assistant Livestock Health Technician | 4th | Agriculture/ Veterinary | 2 | ||
| Kanji House Assistant | 4 | ||||
| 3.6 | Social Development and NGO Coordination Section | Administrative Officer/ Sr. Admin Officer | 7/8th | Admin/ General Admin | 1 |
| Senior Admin Assistant/ Assistant Admin Officer | 5/6th | Admin/ General Admin | 1 | ||
| 3.7 | Employment Promotion and Safe Migration Unit | Senior Admin Assistant/ Assistant Admin Officer | 5/6th | Admin/ General Admin | 2 |
| Administration Assistant | 4th | Admin/ General Admin | 2 | ||
| Office Helper | 4 | ||||
| Total | 42 | ||||
| 4 | Education and Sports Division | Senior/ Education Director | 9/10th | Education/ Edu Admin, Testing & Eval | 1 |
| 4.1 | Education Planning and Program Section | Education Officer/ Sr. Edu Officer | 7/8th | Education/ Edu Admin, Testing & Eval | 1 |
| Education Assistant/ Assistant Edu Officer | 5/6th | Education/ Edu Admin, Testing & Eval | 1 | ||
| 4.2 | School Administration Section | Education Officer/ Sr. Edu Officer | 7/8th | Education/ Edu Admin, Testing & Eval | 1 |
| Education Assistant/ Assistant Edu Officer | 5/6th | Education/ Edu Admin, Testing & Eval | 1 | ||
| 4.3 | Examination, Youth and Sports Section | Education Officer/ Sr. Edu Officer | 7/8th | Education/ Edu Admin, Testing & Eval | 1 |
| Education Assistant/ Assistant Edu Officer | 5/6th | Education/ Edu Admin, Testing & Eval | 1 | ||
| Office Helper | 1 | ||||
| Total | 8 | ||||
| 5 | Urban Development and Infrastructure Division | Divisional Engineer | 9/10th | Engineering Service | 1 |
| 5.1 | Infrastructure Development Section | Engineer/ Senior Engineer | 7/8th | Engi./ Civil | 4 |
| Sub-Engineer/ Assistant Admin | 5/6th | Engi./ Civil | 4 | ||
| Drinking Water Lab Technician | 4/5th | Engi./ Civil | 1 | ||
| 5.2 | House Map Section | Engineer/ Senior Engineer | 7/8th | Engi./ Civil | 1 |
| Engineer/ Senior Engineer | 7/8th | Engi./ Architect | 1 | ||
| Senior Admin Assistant/ Assistant Admin Officer | 5/6th | Admin/ General Admin | 2 | ||
| Sub-Engineer/ Assistant Admin Officer | 5/6th | Engi./ Civil | 2 | ||
| Amin | 4th | Engi./ Survey | 2 | ||
| 5.3 | Quality Testing Section | Engineer/ Senior Engineer | 7/8th | Engi./ Civil | 1 |
| Lab Technician/ Sr. Lab Tech | 5/6th | Engi./ Civil | 1 | ||
| 5.4 | Maintenance Unit | Sub-Engineer/ Assistant Admin Officer | 5/6th | Engi./ Civil | 1 |
| 5.5 | Electricity Management Unit | Sub-Engineer | 5th | 1 | |
| Electrician/ Supervisor | 7 | ||||
| Electricity Assistant, Ladder Carrier | 10 | ||||
| 5.6 | For Ward Office | Sub-Engineer/ Assistant Admin Officer | 5/6th | Engi./ Civil | 10 |
| Driver | 1 | ||||
| Office Helper | 4 | ||||
| Total | 54 | ||||
| 6 | Health Division | Public Health Administrator/ Sr. PH Admin | 9/10th | Health/ H.E./ C.N. | 1 |
| 6.1 | Public Health Promotion Section | Public Health Officer/ Sr. PH Officer | 7/8th | Health/ H.E. | 1 |
| H.A./ P.H.I./ Sr. A.H.W. Officer | 5/6/7th | Health/ H.E. | 2 | ||
| Pharmacy Assistant | 5/6/7th | Health/ Pharmacy | 1 | ||
| 6.2 | Family Welfare and Maternal Child Health Section | Nursing Officer/ Sr. Nursing Officer | 7/8th | Health/ P.H.N. | 1 |
| P.H.N./ Sr. A.N.M. Officer | 5/6/7th | Health/ P.H.N. | 1 | ||
| 6.3 | Ayurveda Section | Kaviraj/ Inspector/ Inspector Officer | 5/6/7th | Health/ Ayurveda | 1 |
| Baidya | 4/5/6th | Health/ Ayurveda | 1 | ||
| Office Helper | 2 | ||||
| Total | 11 | ||||
| 7 | Internal Audit Section | Internal Audit Officer/ Sr. IA Officer | 7/8th | Admin/ Accounting | 1 |
| Internal Audit Assistant/ Assistant IA Officer | 5/6th | Admin/ Accounting | 1 | ||
| Total | 2 | ||||
| 8 | Ward Offices | ||||
| 8.1 | For Ward Office | Administrative Officer/ Sr. Admin Officer | 7/8th | Admin/ General Admin | 23 |
| Senior Admin Assistant/ Assistant Admin Officer | 5/6th | Admin/ General Admin | 23 | ||
| Administration Assistant | 4th | Admin/ General Admin | 8 | ||
| Accounting Assistant | 4th | Admin/ General Admin | 23 | ||
| Office Helper | 23 | ||||
| Total | 100 | ||||
| 8.2 | Health Post 11/ Details per Health Post | Officer | 6th | Health/ H.E. | 11 |
| Officer | 6th | Health/ C.N. | 11 | ||
| Assistant | 5th | Health/ H.E. | 22 | ||
| Assistant | 4th | Health/ C.N. | 11 | ||
| Assistant | 4th | Health/ H.E. | 11 | ||
| Office Helper | 11 | ||||
| Lab Assistant | 4/5/6th | Health/ M.L.T. | 3 | ||
| Total | 80 | ||||
| 8.3 | Urban Health Promotion Center | Medical Officer | 8th | Health/ General H.S. | 1 |
| Public Health Officer | 7/8th | Health/ H.E. | 1 | ||
| H.A. | 5/6/7th | Health/ H.E. | 1 | ||
| Staff Nurse | 5/6/7th | Health/ C.N. | 1 | ||
| A.H.W. | 4/5/6th | Health/ H.E. | 1 | ||
| A.N.M. | 4/5/6th | Health/ C.N. | 1 | ||
| Lab | 4/5/6th | Health/ M.L.T. | 1 | ||
| Kaviraj | 5/6/7th | Health/ Ayurveda | 1 | ||
| Therapist | Health/ Physiotherapy | 1 | |||
| Office Helper | 1 | ||||
| Abhyangakarta | 1 | ||||
| Total | 11 | ||||
| 8.4 | Urban Health Center 11 | H.A./ H.A. Assistant/ Sr. H.A. Officer | 4/5/6th | Health/ H.E. | 12 |
| A.N.M. | 4/5/6th | Health/ P.H.N. | 12 | ||
| Office Helper | 12 | ||||
| Total | 36 | ||||
| 8.5 | Ayurveda Dispensary | Kaviraj/ Inspector/ Sr. Kaviraj Inspector | 5/6/7th | Health/ Ayurveda | 3 |
| Baidya | 4/5/6th | Health/ Ayurveda | 3 | ||
| Office Helper/ Medicine Crusher | 6 | ||||
| Total | 12 | ||||
| Grand Total | 722 |
3.14 Social Security
The concept of assisting marginalized and vulnerable senior citizens, single women, and persons with disabilities through state funds in the name of social security allowance is part of the concept of a welfare state. Since B.S. 2051, the social security allowance, which started with the slogan of providing 100 rupees monthly to senior citizens, is now being provided to senior citizens, single women, persons with disabilities, and Dalit senior citizens. It is believed that this encourages disabled people who are backwards in society to live with dignity.
According to the Social Security Act, 2075, the following Nepali citizens are mentioned to receive social security allowance. The ward-wise breakdown of beneficiaries is presented in the table below.
The types and criteria for social security allowances are as follows:
1. Senior Citizen Allowance: Dalit and single women senior citizens after completing 60 years of age and other senior citizens after completing 68 years of age receive senior citizen allowance as prescribed by the Government of Nepal.
2. Indigent Citizen Allowance: Economically indigent citizens receive a certain amount as prescribed by the Government of Nepal as social security allowance.
3. Disabled and Helpless Allowance: Citizens in a disabled and helpless state receive a certain amount as prescribed by the Government of Nepal as social security allowance.
4. Helpless Single Woman Allowance: Widows and other single women who have lower income than prescribed by the Government and have no family members for support, or have family members who are economically indigent or not providing support, also receive this allowance.
5. Disability Allowance: Citizens with full or severe disability receive disability allowance as prescribed by the Government of Nepal.
6. Child Nutrition Allowance: Highly indigent, endangered, and children under five years of age as prescribed by the Government receive child nutrition allowance.
7. Endangered Caste Allowance: Citizens of endangered castes receive social security allowance as prescribed by the Government of Nepal.
8. Caretaker Allowance for those unable to care for themselves: Citizens who are unable to take care of themselves receive social security allowance as prescribed by the Government of Nepal.