Social Status
Education, health, drinking water, art & culture, and peace & security
5.1 Educational and Human Resource Development
Education plays a giant role in the social and economic development of any country. It is taken as an indicator of human development. In this regard, the educational status of the sub-metropolitan city is being showcased here. Education is the primary cornerstone of development; it's a universally accepted theory that developing the inherent talents of individuals through education brings positive change to society and the nation. The paramount role of the education sector is essential for creating an aware, disciplined, and productive workforce. In planning, education has been adopted as a policy-level medium for poverty alleviation and all-round human resource development. State policy also aims to develop education as a primary infrastructure of development, making it accessible and effective for all.
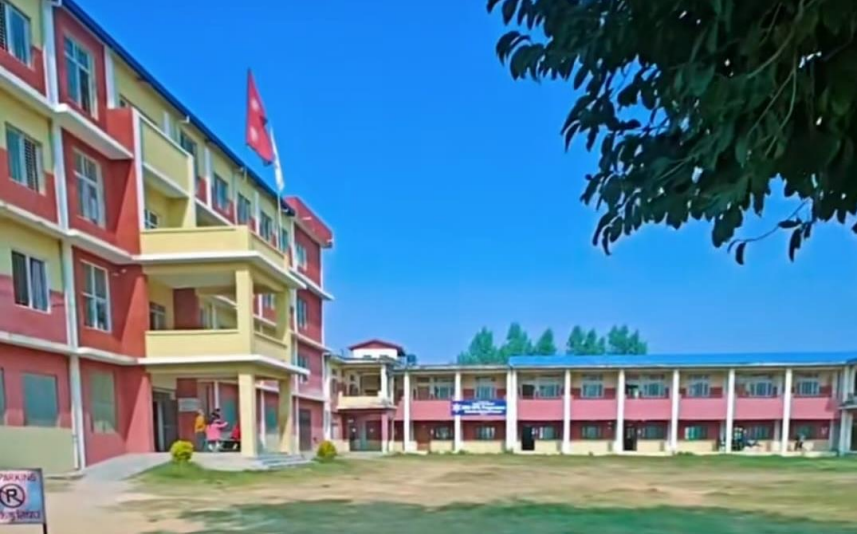
Mahendra Multiple Campus
According to the Constitution of Nepal 2072, Part 3, Article 31, Fundamental Rights regarding education provide the following arrangements:
Every citizen shall have the right to access basic education.
Every citizen shall have the right to compulsory and free basic education and free secondary education from the state.
Citizens with disabilities and economically disadvantaged citizens shall have the right to free higher education in accordance with the law.
Visually-impaired citizens shall have the right to free education through Braille script, and citizens with hearing or speaking impairments shall have the right to free education through sign language.
Every Nepali community residing in Nepal shall have the right to receive education in their mother tongue and for that purpose, establish and operate schools and educational institutions as per the law.
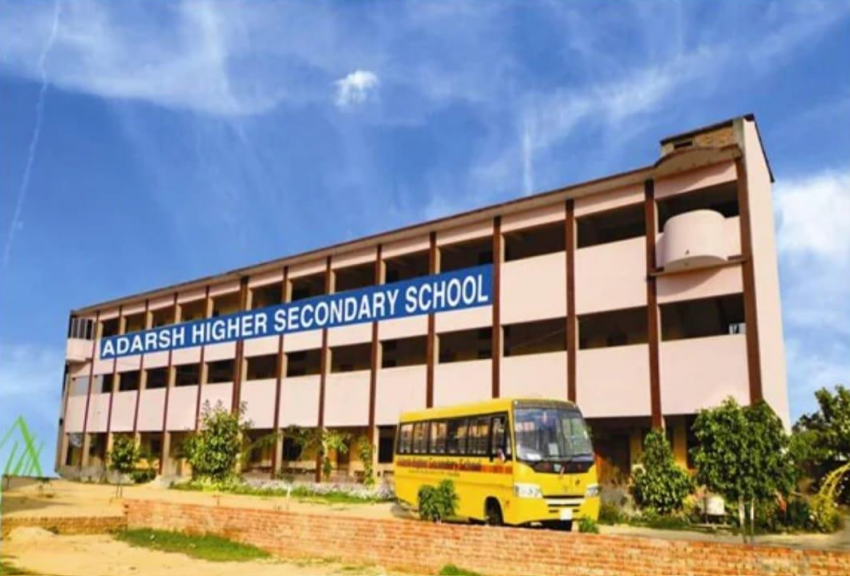
Adarsh Higher Secondary School
Despite grand debates on the constitution and plans, our education sector hasn't seen remarkable development when compared globally. Education must realize the vision of bringing practical changes in knowledge and skills, supporting the marginalized and disadvantaged, and empowering the voiceless to enrich the country. The characteristic of quality education is to help develop leadership capacity, a tireless spirit of teaching and learning, social and human values, and self-confidence. Such education should have an abundance of analytical and original thinking. Quality is more than just prescribed learning. Today, quality education is needed for practical change, faith in labor, life-oriented research, relevance, love for country and culture, moral responsibility, and the use of science in its original form. Through high-quality development in education, people's living standards can be raised through employment opportunities, industrial development, access to facilities, technological expansion, production-oriented agriculture, income-oriented business, and abundant utilization of local resources, which in turn strengthens the sub-metropolitan economy and supports social development.
Adarsh Secondary School (Building-2)
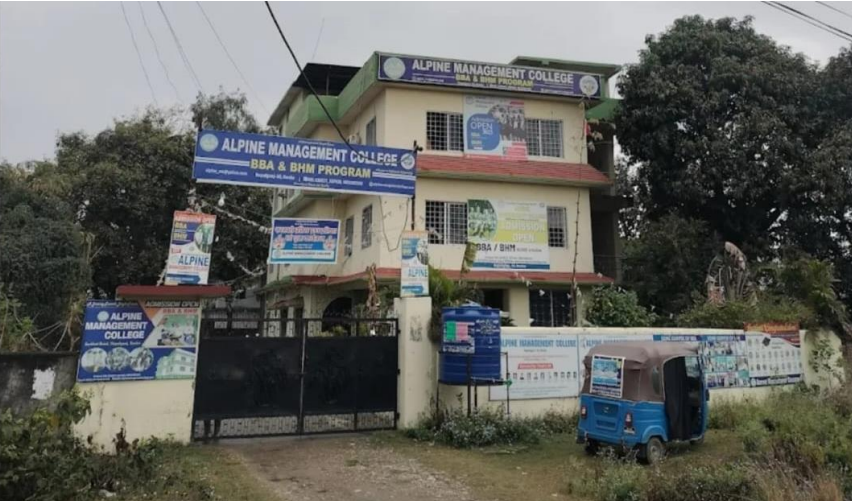
Alpine Management College
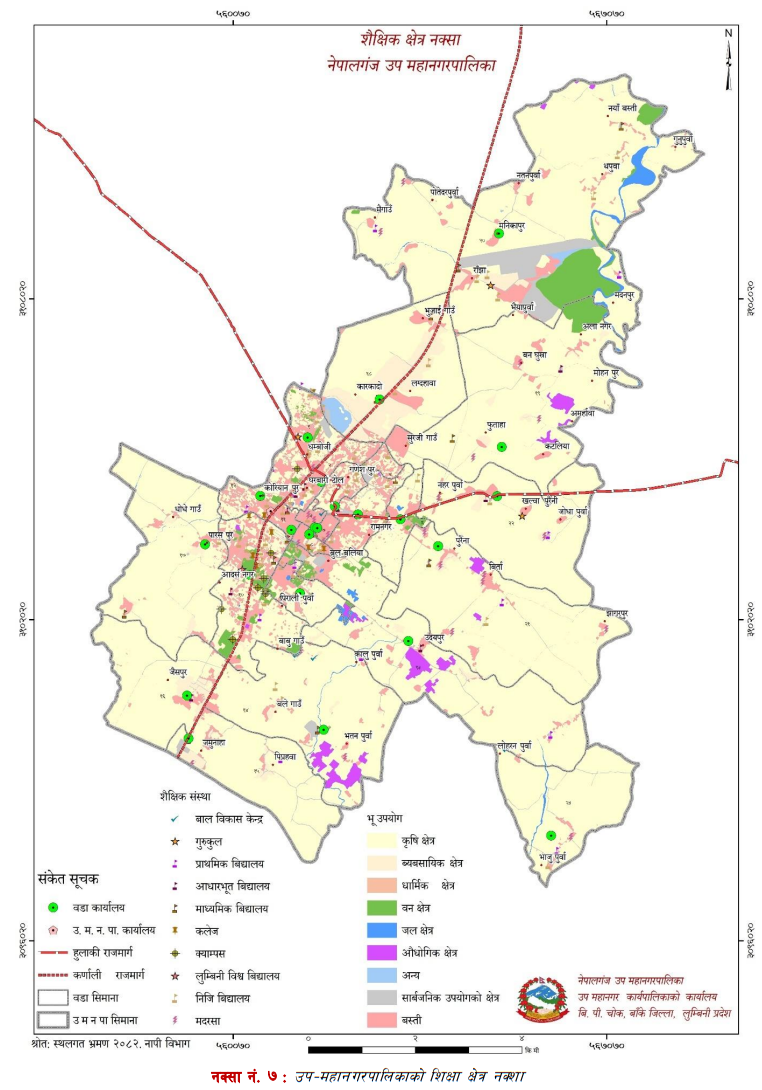
Map No. 7: Education Sector Map of the Sub-Metropolitan City
5.1.1 Literacy of Population Above Five Years
| Ward | Gender | Can Read & Write | Can Read Only | Cannot Read or Write | Not Stated | Total |
|---|---|---|---|---|---|---|
| 1 | Total | 7,352 | 67 | 985 | 2 | 8,406 |
| Male | 3,794 | 25 | 304 | 0 | 4,123 | |
| Female | 3,558 | 42 | 681 | 2 | 4,283 | |
| 2 | Total | 5,277 | 12 | 543 | 0 | 5,832 |
| Male | 2,759 | 6 | 196 | 0 | 2,961 | |
| Female | 2,518 | 6 | 347 | 0 | 2,871 | |
| ... (Wards 3-22 ...) | ... | ... | ... | ... | ... | ... |
| 23 | Total | 922 | 0 | 633 | 0 | 1,555 |
| Total | Male | 69,068 | 351 | 13,944 | 48 | 75,411 |
| Female | 53,641 | 412 | 20,922 | 64 | 75,039 | |
| Total | 114,709 | 763 | 34,866 | 112 | 150,450 | |
| Percentage | 76.24 | 0.51 | 23.17 | 0.07 | 100 |
Literacy indicates the overall human development index beyond just the skill to read and write. In the sub-metropolis, out of the total population of 150,450 aged 5 years and above, 114,709 or 76.24% are literate. The population that can only read is 763 or 0.51%, while the population that cannot read or write (illiterate) is 34,866 or 23.17%. The ward-wise detailed description is mentioned in the table.
Literacy Status of Population Aged 5 Years and Above
Tap bars or slices to view details
A) Literacy Status by Caste/Ethnicity
| Caste/Ethnicity | Can Read & Write | Can Read Only | Cannot Read or Write | Not Stated | Total | Percentage |
|---|---|---|---|---|---|---|
| Chhetri | 17,142 | 33 | 1,388 | 14 | 18,577 | 12.35 |
| Brahman-Hill | 9,115 | 19 | 476 | 4 | 9,614 | 6.39 |
| Magar | 5,177 | 10 | 525 | 4 | 5,716 | 3.80 |
| Tharu | 4,788 | 31 | 498 | 5 | 5,322 | 3.54 |
| Musalman | 26,547 | 408 | 15,085 | 25 | 42,065 | 27.96 |
| Total (All Groups) | 114,709 | 763 | 34,866 | 112 | 150,450 | 100 |
B) Literacy Status Based on Formal Education
UNESCO defined a literate person in 1956 as someone who can read and write with understanding and do basic daily calculations. Nepal also operates its literacy campaign based on this definition. In this sub-metropolis, out of the total population aged 5 to 25 years, 35,267 or 61.10% are currently attending schools or colleges, 12,799 or 22.18% previously attended schools or colleges, and 9,550 or 16.55% have never achieved formal education. Detailed descriptions are presented in the following tables.
| Ward | Gender | Currently Attending | Previously Attended | Never Attended | Not Stated | Total |
|---|---|---|---|---|---|---|
| 1 | Total | 1,900 | 432 | 116 | 2 | 2,450 |
| Male | 1,023 | 214 | 34 | 0 | 1,271 | |
| Female | 877 | 218 | 82 | 2 | 1,179 | |
| 2 | Total | 1,306 | 442 | 70 | 1 | 1,819 |
| Male | 702 | 222 | 32 | 1 | 957 | |
| Female | 604 | 220 | 38 | 0 | 862 | |
| ... (Wards 3-22 ...) | ... | ... | ... | ... | ... | ... |
| 23 | Total | 417 | 269 | 205 | 0 | 891 |
| Total | Male | 18,659 | 6,674 | 4,393 | 53 | 29,779 |
| Female | 16,608 | 6,125 | 5,157 | 48 | 27,938 | |
| Total | 35,267 | 12,799 | 9,550 | 101 | 57,717 | |
| Percentage | 61.10 | 22.18 | 16.55 | 0.17 | 100 |
Literacy Status Based on Formal Education (Ward-wise)
Tap bars or slices to view details
5.1.2 Educational Institutions and Students by Level
A) Community Schools and Students Detail
| S.N. | School Name | Ward No. | CDC (Girls) | CDC (Boys) | CDC (Total) | Class 1-5 (Girls) | Class 1-5 (Boys) | Class 1-5 (Total) | Class 6-8 (Girls) | Class 6-8 (Boys) | Class 6-8 (Total) | Class 9-10 (Girls) | Class 9-10 (Boys) | Class 9-10 (Total) | Class 11-12 (Girls) | Class 11-12 (Boys) | Class 11-12 (Total) |
|---|---|---|---|---|---|---|---|---|---|---|---|---|---|---|---|---|---|
| 1 | Adarsh Secondary School, Ranjha-Banke | 20 | 21 | 26 | 47 | 182 | 222 | 404 | 134 | 115 | 249 | 140 | 108 | 248 | 91 | 47 | 138 |
| 2 | Anathalaya Gaushia Secondary School | 4 | 15 | 26 | 41 | 54 | 117 | 171 | 4 | 37 | 41 | 3 | 18 | 21 | 0 | 0 | 0 |
| 3 | Arun Nepal Primary School | 13 | 83 | 78 | 161 | 216 | 125 | 341 | 35 | 21 | 56 | 0 | 0 | 0 | 0 | 0 | 0 |
| 4 | Bageshwari Primary School | 12 | 21 | 26 | 47 | 93 | 60 | 153 | 24 | 20 | 44 | 0 | 0 | 0 | 0 | 0 | 0 |
| 5 | Bal Mandir Primary School | 9 | 24 | 13 | 37 | 90 | 86 | 176 | 0 | 0 | 0 | 0 | 0 | 0 | 0 | 0 | 0 |
| 6 | Balmiki Basic School | 12 | 8 | 11 | 19 | 31 | 30 | 61 | 0 | 0 | 0 | 0 | 0 | 0 | 0 | 0 | 0 |
| 7 | Basic School Puraini | 22 | 33 | 12 | 45 | 144 | 127 | 271 | 44 | 41 | 85 | 0 | 0 | 0 | 0 | 0 | 0 |
| 8 | Basic School Jaisipur | 16 | 63 | 73 | 136 | 154 | 129 | 283 | 59 | 25 | 84 | 0 | 0 | 0 | 0 | 0 | 0 |
| 9 | Basic School Sangam Nagar | 18 | 12 | 8 | 20 | 25 | 21 | 46 | 0 | 0 | 0 | 0 | 0 | 0 | 0 | 0 | 0 |
| 10 | Basic School Suiya Piparaha | 15 | 17 | 18 | 35 | 96 | 100 | 196 | 0 | 0 | 0 | 0 | 0 | 0 | 0 | 0 | 0 |
| 11 | Bhawani Primary School Madanpur-20 | 20 | 3 | 3 | 6 | 4 | 6 | 10 | 0 | 0 | 0 | 0 | 0 | 0 | 0 | 0 | 0 |
| 12 | Darul Uloom Gulsan Madariya Jiyal Habib | 15 | 9 | 16 | 25 | 61 | 34 | 95 | 0 | 0 | 0 | 0 | 0 | 0 | 0 | 0 | 0 |
| 13 | Dhamboji Secondary School | 1 | 22 | 28 | 50 | 335 | 367 | 702 | 334 | 362 | 696 | 274 | 323 | 597 | 344 | 435 | 779 |
| 14 | Phulteka Secondary School | 6 | 20 | 23 | 43 | 106 | 114 | 220 | 67 | 67 | 134 | 23 | 25 | 48 | 0 | 0 | 0 |
| 15 | Gurukul Deb Sanskriti Gayatri Vidyapith Sanskriti | 1 | 0 | 0 | 0 | 29 | 33 | 62 | 0 | 0 | 0 | 0 | 0 | 0 | 0 | 0 | 0 |
| 16 | Gyan Sagar Secondary School | 17 | 85 | 94 | 179 | 202 | 166 | 368 | 99 | 69 | 168 | 33 | 25 | 58 | 0 | 0 | 0 |
| 17 | Hanuman Basic School | 10 | 2 | 11 | 13 | 54 | 51 | 105 | 0 | 0 | 0 | 0 | 0 | 0 | 0 | 0 | 0 |
| 18 | Jagat Jyoti Secondary School Basudevpur | 19 | 38 | 35 | 73 | 185 | 249 | 434 | 57 | 55 | 112 | 35 | 27 | 62 | 0 | 0 | 0 |
| 19 | Jaya Janata Secondary School | 20 | 19 | 31 | 50 | 128 | 117 | 245 | 94 | 115 | 209 | 74 | 85 | 159 | 68 | 57 | 125 |
| 20 | Karagar Basic School | 10 | 0 | 0 | 0 | 0 | 119 | 119 | 0 | 0 | 0 | 0 | 0 | 0 | 0 | 0 | 0 |
| 21 | Karna Baba Primary School | 21 | 48 | 32 | 80 | 71 | 86 | 157 | 0 | 0 | 0 | 0 | 0 | 0 | 0 | 0 | 0 |
| 22 | Lala Bhuwaneshwari Primary School | 13 | 27 | 21 | 48 | 57 | 28 | 85 | 0 | 0 | 0 | 0 | 0 | 0 | 0 | 0 | 0 |
| 23 | Secondary School Mahendra Nagar | 14 | 110 | 93 | 203 | 125 | 184 | 309 | 63 | 110 | 173 | 20 | 21 | 41 | 0 | 0 | 0 |
| 24 | Madrasa Ahmadiya Darul Islam | 22 | 0 | 0 | 0 | 61 | 58 | 119 | 0 | 0 | 0 | 0 | 0 | 0 | 0 | 0 | 0 |
| 25 | Maharaja Secondary School | 21 | 47 | 62 | 109 | 329 | 311 | 640 | 126 | 129 | 255 | 39 | 47 | 86 | 13 | 2 | 15 |
| 26 | Mahendra Secondary School Ranitalau | 7 | 15 | 12 | 27 | 88 | 142 | 230 | 57 | 122 | 179 | 50 | 75 | 125 | 79 | 91 | 170 |
| 27 | Mangal Secondary School | 8 | 35 | 24 | 59 | 156 | 280 | 436 | 239 | 481 | 720 | 225 | 462 | 687 | 627 | 555 | 1182 |
| 28 | Narayan Secondary School Nepalgunj | 11 | 10 | 11 | 21 | 67 | 135 | 202 | 40 | 103 | 143 | 35 | 51 | 86 | 29 | 62 | 91 |
| 29 | Navajyoti Boarding School | 14 | 34 | 60 | 94 | 51 | 66 | 117 | 2 | 2 | 4 | 0 | 0 | 0 | 0 | 0 | 0 |
| 30 | N.R. Primary School Faltupuriya | 14 | 18 | 12 | 30 | 104 | 80 | 184 | 0 | 0 | 0 | 0 | 0 | 0 | 0 | 0 | 0 |
| 31 | Nepal Rastriya Secondary School | 19 | 36 | 38 | 74 | 131 | 123 | 254 | 57 | 74 | 131 | 43 | 40 | 83 | 0 | 0 | 0 |
| 32 | Nepal Rastriya Basic School | 20 | 24 | 33 | 57 | 106 | 80 | 186 | 42 | 35 | 77 | 0 | 0 | 0 | 0 | 0 | 0 |
| 33 | Nepalgunj Kanya Secondary School | 4 | 61 | 0 | 61 | 323 | 0 | 323 | 143 | 0 | 143 | 100 | 0 | 100 | 14 | 0 | 14 |
| 34 | Pateshwari Basic School | 18 | 24 | 30 | 54 | 98 | 100 | 198 | 72 | 57 | 129 | 0 | 0 | 0 | 0 | 0 | 0 |
| 35 | Primary School Bageshwari Tol | 2 | 12 | 12 | 24 | 18 | 17 | 35 | 0 | 0 | 0 | 0 | 0 | 0 | 0 | 0 | 0 |
| 36 | Primary School Fingriyanpurwa | 22 | 35 | 40 | 75 | 117 | 113 | 230 | 0 | 0 | 0 | 0 | 0 | 0 | 0 | 0 | 0 |
| 37 | Primary School Jangalisinh Purwa | 23 | 28 | 40 | 68 | 127 | 190 | 317 | 0 | 0 | 0 | 0 | 0 | 0 | 0 | 0 | 0 |
| 38 | Ram Janaki N. Primary School | 20 | 11 | 11 | 22 | 30 | 25 | 55 | 0 | 0 | 0 | 0 | 0 | 0 | 0 | 0 | 0 |
| 39 | Ram Janaki Rastriya Primary School Pharkado | 18 | 13 | 7 | 20 | 48 | 31 | 79 | 0 | 0 | 0 | 0 | 0 | 0 | 0 | 0 | 0 |
| 40 | Sharda Basic School | 10 | 16 | 17 | 33 | 86 | 96 | 182 | 38 | 63 | 101 | 0 | 0 | 0 | 0 | 0 | 0 |
| 41 | Saraswati Secondary School Nepalgunj | 10 | 0 | 0 | 0 | 269 | 0 | 269 | 211 | 0 | 211 | 126 | 0 | 126 | 62 | 0 | 62 |
| 42 | Saraswati Primary School Bankegaun | 9 | 10 | 14 | 24 | 62 | 69 | 131 | 0 | 0 | 0 | 0 | 0 | 0 | 0 | 0 | 0 |
| 43 | Shree Deutadin Secondary School | 18 | 11 | 20 | 31 | 87 | 99 | 186 | 52 | 57 | 109 | 48 | 20 | 68 | 0 | 0 | 0 |
| 44 | Shree Hanuman Basic School | 15 | 34 | 36 | 70 | 118 | 132 | 250 | 16 | 21 | 37 | 0 | 0 | 0 | 0 | 0 | 0 |
| 45 | Shree Nepal Rastriya Basic School | 2 | 9 | 14 | 23 | 62 | 60 | 122 | 29 | 30 | 59 | 0 | 0 | 0 | 0 | 0 | 0 |
| 46 | Yuddha Sanskriti Secondary School | 10 | 8 | 12 | 20 | 39 | 41 | 80 | 17 | 33 | 50 | 10 | 11 | 21 | 0 | 0 | 0 |
| Total | 1,171 | 1,183 | 2,354 | 5,019 | 4,819 | 9,838 | 2,155 | 2,244 | 4,399 | 1,278 | 1,346 | 2,624 | 1,327 | 1,249 | 2,576 |
B) Institutional Schools and Students Detail
| S.N. | School Name | Ward No. | CDC (Girls) | CDC (Boys) | CDC (Total) | Class 1-5 (Girls) | Class 1-5 (Boys) | Class 1-5 (Total) | Class 6-8 (Girls) | Class 6-8 (Boys) | Class 6-8 (Total) | Class 9-10 (Girls) | Class 9-10 (Boys) | Class 9-10 (Total) | Class 11-12 (Girls) | Class 11-12 (Boys) | Class 11-12 (Total) |
|---|---|---|---|---|---|---|---|---|---|---|---|---|---|---|---|---|---|
| 1 | A.B.C. Residential School | 4 | 122 | 155 | 277 | 125 | 189 | 314 | 71 | 89 | 160 | 30 | 48 | 78 | 14 | 34 | 48 |
| 2 | Adarsh Secondary School | 10 | 66 | 64 | 130 | 195 | 301 | 496 | 113 | 133 | 246 | 68 | 97 | 165 | 409 | 399 | 808 |
| 3 | Angel Secondary School | 2 | 23 | 35 | 58 | 162 | 228 | 390 | 84 | 140 | 224 | 46 | 78 | 124 | 0 | 0 | 0 |
| 4 | Arunima Vidya Sadan | 6 | 51 | 83 | 134 | 42 | 75 | 117 | 0 | 0 | 0 | 0 | 0 | 0 | 0 | 0 | 0 |
| 5 | Baijapur Youth Vision Secondary English Medium School | 4 | 49 | 82 | 131 | 103 | 138 | 241 | 46 | 64 | 110 | 14 | 17 | 31 | 0 | 0 | 0 |
| 6 | Banke Shiksha Secondary School | 10 | 16 | 21 | 37 | 24 | 38 | 62 | 8 | 10 | 18 | 0 | 0 | 0 | 0 | 0 | 0 |
| 7 | Bheri English Medium Secondary School | 1 | 37 | 47 | 84 | 47 | 64 | 111 | 27 | 39 | 66 | 16 | 25 | 41 | 0 | 0 | 0 |
| 8 | Bhrikuti Secondary School | 1 | 31 | 44 | 75 | 43 | 65 | 108 | 9 | 20 | 29 | 0 | 0 | 0 | 0 | 0 | 0 |
| 9 | Vinayak Educational Academy | 9 | 64 | 118 | 182 | 65 | 104 | 169 | 20 | 48 | 68 | 6 | 25 | 31 | 0 | 0 | 0 |
| 10 | Virat Gurukul English Medium School | 20 | 22 | 21 | 43 | 45 | 75 | 120 | 12 | 22 | 34 | 9 | 12 | 21 | 0 | 0 | 0 |
| 11 | Bright Hope Academy Nepalgunj | 18 | 22 | 23 | 45 | 165 | 190 | 355 | 51 | 69 | 120 | 11 | 17 | 28 | 0 | 0 | 0 |
| 12 | Bright Land Secondary School | 10 | 34 | 67 | 101 | 166 | 253 | 419 | 101 | 164 | 265 | 57 | 101 | 158 | 162 | 237 | 399 |
| 13 | British English Boarding School | 19 | 32 | 43 | 75 | 42 | 65 | 107 | 15 | 33 | 48 | 12 | 16 | 28 | 0 | 0 | 0 |
| 14 | City Public Secondary School | 11 | 33 | 60 | 93 | 31 | 39 | 70 | 11 | 15 | 26 | 8 | 14 | 22 | 36 | 35 | 71 |
| 15 | Creative Children Home | 11 | 20 | 35 | 55 | 0 | 0 | 0 | 0 | 0 | 0 | 0 | 0 | 0 | 0 | 0 | 0 |
| 16 | Dakar English Boarding School | 20 | 53 | 68 | 121 | 62 | 61 | 123 | 23 | 27 | 50 | 6 | 5 | 11 | 0 | 0 | 0 |
| 17 | Daniel English Boarding School | 14 | 43 | 89 | 132 | 37 | 79 | 116 | 0 | 0 | 0 | 0 | 0 | 0 | 0 | 0 | 0 |
| 18 | Darul Madina | 5 | 124 | 115 | 239 | 71 | 60 | 131 | 0 | 0 | 0 | 0 | 0 | 0 | 0 | 0 | 0 |
| 19 | Dreamland English Medium High School | 20 | 0 | 0 | 0 | 112 | 183 | 295 | 62 | 86 | 148 | 23 | 40 | 63 | 0 | 0 | 0 |
| 20 | Euro Baby Zone School | 24 | 6 | 8 | 14 | 21 | 40 | 61 | 0 | 0 | 0 | 0 | 0 | 0 | 0 | 0 | 0 |
| 21 | Golden ABC Academy Banke H.S. | 4 | 80 | 129 | 209 | 272 | 508 | 780 | 127 | 216 | 343 | 103 | 99 | 202 | 0 | 0 | 0 |
| 22 | Grace Public School Nepalgunj | 4 | 43 | 50 | 93 | 69 | 106 | 175 | 23 | 41 | 64 | 9 | 14 | 23 | 11 | 8 | 19 |
| 23 | Gyanodaya Vidya Niketan English Medium School | 9 | 29 | 33 | 62 | 117 | 160 | 277 | 38 | 76 | 114 | 36 | 54 | 90 | 323 | 434 | 757 |
| 24 | Happy Hope English Medium School | 22 | 124 | 184 | 308 | 106 | 213 | 319 | 34 | 52 | 86 | 8 | 16 | 24 | 0 | 0 | 0 |
| 25 | Himalayan Academy | 20 | 113 | 145 | 258 | 111 | 128 | 239 | 27 | 32 | 59 | 0 | 0 | 0 | 0 | 0 | 0 |
| 26 | Holyland English Secondary School | 10 | 49 | 92 | 141 | 108 | 122 | 230 | 56 | 64 | 120 | 30 | 48 | 78 | 67 | 97 | 164 |
| 27 | Hope International Academy | 2 | 4 | 3 | 7 | 121 | 200 | 321 | 42 | 85 | 127 | 25 | 56 | 81 | 36 | 53 | 89 |
| 28 | Ideal Public Secondary School | 7 | 122 | 181 | 303 | 338 | 426 | 764 | 111 | 119 | 230 | 49 | 47 | 96 | 49 | 41 | 90 |
| 29 | Institute of Crystal Knowledge Boarding School | 6 | 44 | 49 | 93 | 147 | 255 | 402 | 45 | 72 | 117 | 19 | 28 | 47 | 0 | 0 | 0 |
| 30 | Islamic Children Academy | 3 | 24 | 22 | 46 | 23 | 20 | 43 | 6 | 0 | 6 | 0 | 0 | 0 | 0 | 0 | 0 |
| 31 | Jayabageshwari Vidya Niketan Pvt. Ltd. | 17 | 41 | 88 | 129 | 54 | 151 | 205 | 17 | 42 | 59 | 8 | 12 | 20 | 0 | 0 | 0 |
| 32 | Jayabageshwari Higher Secondary School Surkhet Road | 2 | 81 | 118 | 207 | 106 | 146 | 252 | 63 | 93 | 156 | 56 | 67 | 123 | 47 | 70 | 117 |
| 33 | J.C. Bal Sansar English Medium School | 5 | 4 | 2 | 6 | 66 | 102 | 168 | 0 | 0 | 0 | 0 | 0 | 0 | 0 | 0 | 0 |
| 34 | Junior Cambridge Secondary School | 6 | 34 | 70 | 104 | 125 | 245 | 370 | 32 | 42 | 74 | 6 | 16 | 22 | 4 | 4 | 8 |
| 35 | Junior Cambridge Secondary School | 7 | 19 | 23 | 42 | 56 | 63 | 119 | 27 | 30 | 57 | 9 | 19 | 28 | 0 | 0 | 0 |
| 36 | Kamal Pokhari English Medium Boarding School | 20 | 15 | 23 | 38 | 11 | 34 | 45 | 0 | 0 | 0 | 0 | 0 | 0 | 0 | 0 | 0 |
| 37 | Kids Kingdom Nepalgunj | 4 | 84 | 91 | 175 | 79 | 70 | 149 | 0 | 0 | 0 | 0 | 0 | 0 | 0 | 0 | 0 |
| 38 | Little Horizon Montessori School | 4 | 29 | 40 | 69 | 0 | 0 | 0 | 0 | 0 | 0 | 0 | 0 | 0 | 0 | 0 | 0 |
| 39 | Little Oxford English Secondary School | 5 | 30 | 72 | 102 | 42 | 63 | 105 | 19 | 21 | 40 | 2 | 1 | 3 | 0 | 0 | 0 |
| 40 | Living Stone Academy Nepalgunj | 6 | 29 | 30 | 59 | 25 | 21 | 46 | 7 | 10 | 17 | 0 | 0 | 0 | 0 | 0 | 0 |
| 41 | Lotus English Boarding School | 2 | 38 | 41 | 79 | 55 | 65 | 120 | 27 | 42 | 69 | 24 | 18 | 42 | 0 | 0 | 0 |
| 42 | Madrasa Jamia Darul Uloom Islamia | 16 | 0 | 0 | 0 | 43 | 31 | 74 | 0 | 0 | 0 | 0 | 0 | 0 | 0 | 0 | 0 |
| 43 | Manakamana English Boarding School | 18 | 87 | 105 | 192 | 117 | 162 | 279 | 67 | 69 | 136 | 24 | 29 | 53 | 1 | 1 | 2 |
| 44 | Marigold English Boarding School | 19 | 65 | 85 | 150 | 74 | 131 | 205 | 31 | 59 | 90 | 14 | 20 | 34 | 5 | 3 | 8 |
| 45 | Mayasadan Resident Boarding School | 22 | 46 | 81 | 127 | 53 | 97 | 150 | 9 | 21 | 30 | 0 | 0 | 0 | 0 | 0 | 0 |
| 46 | Mero Tuki Prajalaya | 1 | 21 | 27 | 48 | 8 | 7 | 15 | 0 | 0 | 0 | 0 | 0 | 0 | 0 | 0 | 0 |
| 47 | Modern Creative Children Zone | 19 | 35 | 48 | 83 | 0 | 0 | 0 | 0 | 0 | 0 | 0 | 0 | 0 | 0 | 0 | 0 |
| 48 | Modern Public English Boarding School | 12 | 50 | 78 | 128 | 82 | 124 | 206 | 41 | 79 | 120 | 31 | 54 | 85 | 129 | 119 | 248 |
| 49 | Montessori Smart Kids | 10 | 68 | 52 | 120 | 32 | 31 | 63 | 0 | 0 | 0 | 0 | 0 | 0 | 0 | 0 | 0 |
| 50 | Muntara English Medium High School | 20 | 47 | 83 | 130 | 74 | 144 | 218 | 41 | 58 | 99 | 22 | 28 | 50 | 0 | 0 | 0 |
| 51 | Nepal Academy English Medium School | 21 | 30 | 91 | 121 | 15 | 29 | 44 | 0 | 0 | 0 | 0 | 0 | 0 | 0 | 0 | 0 |
| 52 | Nepalgunj Model Academy | 18 | 67 | 91 | 158 | 169 | 286 | 455 | 97 | 111 | 208 | 45 | 74 | 119 | 55 | 69 | 124 |
| 53 | Nepalgunj St. Xavier School | 1 | 103 | 184 | 288 | 103 | 144 | 247 | 36 | 96 | 132 | 22 | 50 | 72 | 96 | 144 | 240 |
| 54 | New Assembly of God English Boarding School | 13 | 42 | 111 | 151 | 39 | 60 | 99 | 0 | 0 | 0 | 0 | 0 | 0 | 0 | 0 | 0 |
| 55 | New Galaxy School Nepalgunj | 10 | 12 | 12 | 24 | 55 | 96 | 151 | 20 | 26 | 46 | 7 | 12 | 19 | 0 | 0 | 0 |
| 56 | New Vision English Boarding School | 8 | 19 | 34 | 53 | 23 | 20 | 43 | 0 | 0 | 0 | 0 | 0 | 0 | 0 | 0 | 0 |
| 57 | Nirmal Jyoti English Boarding School Mohanpur | 19 | 32 | 33 | 65 | 28 | 46 | 74 | 0 | 0 | 0 | 0 | 0 | 0 | 0 | 0 | 0 |
| 58 | Pashupati English Boarding School | 20 | 44 | 69 | 113 | 122 | 188 | 310 | 85 | 125 | 210 | 52 | 76 | 128 | 0 | 1 | 1 |
| 59 | Pashupati Shiksha Mandir | 5 | 20 | 22 | 42 | 22 | 55 | 77 | 11 | 13 | 24 | 0 | 0 | 0 | 0 | 0 | 0 |
| 60 | Parbat Memorial High School | 10 | 0 | 0 | 0 | 69 | 154 | 223 | 31 | 58 | 89 | 19 | 28 | 47 | 9 | 24 | 33 |
| 61 | Ram Gopal English Memorial School | 17 | 36 | 91 | 127 | 39 | 77 | 116 | 23 | 22 | 45 | 0 | 0 | 0 | 0 | 0 | 0 |
| 62 | Red Hill Academy Basic School | 10 | 17 | 58 | 75 | 66 | 106 | 172 | 6 | 13 | 19 | 0 | 0 | 0 | 0 | 0 | 0 |
| 63 | Sagarmatha English Boarding School Karkado | 18 | 25 | 29 | 54 | 88 | 120 | 208 | 85 | 88 | 173 | 34 | 42 | 76 | 58 | 96 | 154 |
| 64 | St. Umer Public Basic School | 3 | 22 | 38 | 60 | 52 | 68 | 120 | 0 | 0 | 0 | 0 | 0 | 0 | 0 | 0 | 0 |
| 65 | Samabeshi English Boarding School Buspark | 4 | 70 | 75 | 145 | 72 | 73 | 145 | 30 | 22 | 52 | 19 | 21 | 40 | 0 | 0 | 0 |
| 66 | Sanskar Vidya Niketan | 17 | 28 | 40 | 68 | 53 | 74 | 127 | 0 | 0 | 0 | 0 | 0 | 0 | 0 | 0 | 0 |
| 67 | Sandipan Vidya Niketan | 18 | 39 | 62 | 101 | 40 | 66 | 106 | 5 | 4 | 9 | 0 | 0 | 0 | 0 | 0 | 0 |
| 68 | Shanti Vidya Niketan Banke | 1 | 136 | 180 | 316 | 113 | 152 | 265 | 43 | 55 | 98 | 21 | 25 | 46 | 0 | 0 | 0 |
| 69 | Shining Future Academy | 5 | 48 | 118 | 166 | 141 | 323 | 464 | 15 | 26 | 41 | 0 | 0 | 0 | 0 | 0 | 0 |
| 70 | Shree Buddha English Medium Secondary School | 4 | 18 | 29 | 47 | 42 | 61 | 103 | 28 | 32 | 60 | 22 | 17 | 39 | 0 | 0 | 0 |
| 71 | Shree Pashupati English Medium Boarding School | 14 | 29 | 37 | 66 | 82 | 166 | 248 | 11 | 31 | 42 | 0 | 0 | 0 | 0 | 0 | 0 |
| 72 | Shree Shaileshwari Vidya Niketan School | 10 | 47 | 83 | 130 | 76 | 110 | 186 | 28 | 47 | 75 | 14 | 23 | 37 | 0 | 0 | 0 |
| 73 | Sirichandra Mewalal Secondary School | 7 | 0 | 10 | 10 | 47 | 56 | 103 | 8 | 4 | 12 | 14 | 11 | 25 | 1 | 0 | 1 |
| 74 | Siddharth Vidya Sadan | 6 | 26 | 47 | 73 | 124 | 193 | 317 | 69 | 70 | 139 | 43 | 43 | 86 | 25 | 33 | 58 |
| 75 | Sophia R.I. English School | 10 | 51 | 99 | 150 | 206 | 236 | 442 | 57 | 82 | 139 | 23 | 29 | 52 | 17 | 12 | 29 |
| 76 | Spring Dale | 14 | 0 | 0 | 0 | 92 | 110 | 202 | 50 | 72 | 122 | 25 | 41 | 66 | 26 | 61 | 87 |
| 77 | St. Thomas English Boarding School | 1 | 19 | 20 | 39 | 78 | 91 | 169 | 29 | 55 | 84 | 23 | 32 | 55 | 23 | 38 | 61 |
| 78 | Star Future Secondary School | 1 | 17 | 36 | 53 | 115 | 180 | 295 | 41 | 61 | 102 | 24 | 40 | 64 | 0 | 0 | 0 |
| 79 | Star Light Academy School | 1 | 16 | 24 | 40 | 20 | 39 | 59 | 3 | 5 | 8 | 0 | 0 | 0 | 0 | 0 | 0 |
| 80 | Success English Medium Basic School | 20 | 24 | 42 | 66 | 38 | 68 | 106 | 10 | 20 | 30 | 0 | 0 | 0 | 0 | 0 | 0 |
| 81 | Sunbeam English Boarding School | 1 | 41 | 65 | 106 | 80 | 113 | 193 | 43 | 57 | 100 | 30 | 33 | 63 | 33 | 60 | 93 |
| 82 | United Educational Academy | 12 | 98 | 165 | 263 | 184 | 236 | 420 | 88 | 126 | 214 | 59 | 69 | 128 | 145 | 226 | 371 |
| 83 | Ost Zone English Boarding School | 13 | 60 | 109 | 169 | 148 | 240 | 388 | 63 | 90 | 153 | 41 | 46 | 87 | 0 | 0 | 0 |
| Total | 3,547 | 5,336 | 8,883 | 6,713 | 10,108 | 16,821 | 2,566 | 3,686 | 6,252 | 1,318 | 1,833 | 3,151 | 1,781 | 2,299 | 4,080 |
C) Religious Schools and Students Detail
| S.N. | School Name | Ward No. | CDC (Girls) | CDC (Boys) | CDC (Total) | Class 1-5 (Girls) | Class 1-5 (Boys) | Class 1-5 (Total) | Class 6-8 (Girls) | Class 6-8 (Boys) | Class 6-8 (Total) | Class 9-10 (Girls) | Class 9-10 (Boys) | Class 9-10 (Total) | Class 11-12 (Girls) | Class 11-12 (Boys) | Class 11-12 (Total) |
|---|---|---|---|---|---|---|---|---|---|---|---|---|---|---|---|---|---|
| 1 | Adara Miswahiya Gulsan Danis Madrasa | 6 | 0 | 0 | 0 | 40 | 66 | 106 | 6 | 4 | 10 | 0 | 0 | 0 | 0 | 0 | 0 |
| 2 | Ayusha Madrastul Banet Secondary School | 4 | 201 | 0 | 201 | 254 | 0 | 254 | 81 | 0 | 81 | 38 | 0 | 38 | 0 | 0 | 0 |
| 3 | Aljayatul Islamia Rajul Uloom Madrasa | 22 | 23 | 11 | 34 | 107 | 76 | 183 | 0 | 0 | 0 | 0 | 0 | 0 | 0 | 0 | 0 |
| 4 | Darul Uloom Gulsan Raja | 22 | 0 | 0 | 0 | 107 | 62 | 169 | 0 | 0 | 0 | 0 | 0 | 0 | 0 | 0 | 0 |
| 5 | Darul Uloom Badiudhiniyan Gulsan Ibrahim | 6 | 0 | 0 | 0 | 66 | 26 | 92 | 0 | 0 | 0 | 0 | 0 | 0 | 0 | 0 | 0 |
| 6 | Darul Uloom Mainiya Faizan Gazi | 16 | 0 | 0 | 0 | 78 | 36 | 114 | 0 | 0 | 0 | 0 | 0 | 0 | 0 | 0 | 0 |
| 7 | Darul Uloom Atai Mustaf Mohanpur | 23 | 0 | 0 | 0 | 64 | 40 | 104 | 0 | 0 | 0 | 0 | 0 | 0 | 0 | 0 | 0 |
| 8 | Darul Uloom Gulsan Madina Madrasa | 4 | 0 | 0 | 0 | 105 | 99 | 204 | 0 | 0 | 0 | 0 | 0 | 0 | 0 | 0 | 0 |
| 9 | Gulsan Basiya Talimul Quran Idgah | 23 | 0 | 0 | 0 | 118 | 84 | 202 | 0 | 0 | 0 | 0 | 0 | 0 | 0 | 0 | 0 |
| 10 | Jamia Arabia Mifatul Ulom | 3 | 19 | 46 | 65 | 75 | 131 | 206 | 9 | 9 | 18 | 0 | 0 | 0 | 0 | 0 | 0 |
| 11 | Jamia Islamia Raja E Mustaf Madrasa | 19 | 0 | 0 | 0 | 95 | 50 | 145 | 0 | 0 | 0 | 0 | 0 | 0 | 0 | 0 | 0 |
| 12 | Jamia Moniya Wadarul Uloom Madrasa | 22 | 0 | 0 | 0 | 73 | 43 | 116 | 0 | 0 | 0 | 0 | 0 | 0 | 0 | 0 | 0 |
| 13 | Madrasa Jamia Kadariya Jiyal Quran | 20 | 0 | 0 | 0 | 87 | 50 | 137 | 0 | 0 | 0 | 0 | 0 | 0 | 0 | 0 | 0 |
| 14 | Madrasa Jamia Arafiya Branisayul Uloom | 16 | 8 | 8 | 16 | 122 | 77 | 199 | 0 | 0 | 0 | 0 | 0 | 0 | 0 | 0 | 0 |
| 15 | Madrasa Darul Uloom Barkatiya | 11 | 39 | 65 | 104 | 231 | 270 | 501 | 147 | 163 | 310 | 37 | 16 | 53 | 0 | 0 | 0 |
| 16 | Madrasa Darul Uloom Juma Garib Nawaj | 16 | 11 | 14 | 25 | 127 | 66 | 193 | 0 | 0 | 0 | 0 | 0 | 0 | 0 | 0 | 0 |
| 17 | Madrasa Alpha Koriyanpur | 16 | 0 | 0 | 0 | 40 | 32 | 72 | 0 | 0 | 0 | 0 | 0 | 0 | 0 | 0 | 0 |
| 18 | Madrasa Amaniyal Banet | 4 | 0 | 0 | 0 | 81 | 0 | 81 | 0 | 0 | 0 | 0 | 0 | 0 | 0 | 0 | 0 |
| 19 | Madrasa Arbiya Jamiyul Hasanet | 16 | 29 | 16 | 45 | 123 | 62 | 185 | 0 | 0 | 0 | 0 | 0 | 0 | 0 | 0 | 0 |
| 20 | Madrasa Chistiya Garib Nawaj | 20 | 0 | 0 | 0 | 98 | 79 | 177 | 0 | 0 | 0 | 0 | 0 | 0 | 0 | 0 | 0 |
| 21 | Madrasa Chistiya Miswaiya Tamsasari | 15 | 45 | 23 | 68 | 98 | 52 | 150 | 0 | 0 | 0 | 0 | 0 | 0 | 0 | 0 | 0 |
| 22 | Madrasa Darul Uloom Arfiya | 6 | 4 | 8 | 12 | 63 | 96 | 159 | 0 | 0 | 0 | 0 | 0 | 0 | 0 | 0 | 0 |
| 23 | Madrasa Darul Uloom Garib Nawaj | 16 | 33 | 25 | 58 | 70 | 41 | 111 | 0 | 0 | 0 | 0 | 0 | 0 | 0 | 0 | 0 |
| 24 | Madrasa Gajiya Aravarlum | 22 | 0 | 0 | 0 | 48 | 24 | 72 | 0 | 0 | 0 | 0 | 0 | 0 | 0 | 0 | 0 |
| 25 | Madrasa Gulsangaji | 14 | 0 | 0 | 0 | 48 | 46 | 94 | 0 | 0 | 0 | 0 | 0 | 0 | 0 | 0 | 0 |
| 26 | Madrasa Hussain Gajiwal Uloom | 1 | 0 | 0 | 0 | 49 | 45 | 94 | 0 | 0 | 0 | 0 | 0 | 0 | 0 | 0 | 0 |
| 27 | Madrasa Islamia Faizul Uloom | 8 | 0 | 0 | 0 | 55 | 43 | 98 | 0 | 0 | 0 | 0 | 0 | 0 | 0 | 0 | 0 |
| 28 | Madrasa Jamia Misoiya Chistia Rahmatul Alam | 15 | 17 | 8 | 25 | 80 | 45 | 125 | 0 | 0 | 0 | 0 | 0 | 0 | 0 | 0 | 0 |
| 29 | Madrasa Jamia Habibiya Darul Raja Karkando | 18 | 0 | 0 | 0 | 7 | 15 | 22 | 0 | 0 | 0 | 0 | 0 | 0 | 0 | 0 | 0 |
| 30 | Madrasa Kadariya Gulsan Raja Jagarpur | 23 | 18 | 7 | 25 | 72 | 36 | 108 | 0 | 0 | 0 | 0 | 0 | 0 | 0 | 0 | 0 |
| 31 | Madrasa Maksudia | 13 | 18 | 7 | 25 | 86 | 72 | 158 | 0 | 0 | 0 | 0 | 0 | 0 | 0 | 0 | 0 |
| 32 | Madrasa Nurani Islamia | 15 | 51 | 19 | 70 | 102 | 49 | 151 | 0 | 0 | 0 | 0 | 0 | 0 | 0 | 0 | 0 |
| 33 | Madrasa Etimkhan Kadaria Akbural Aaloom | 21 | 0 | 0 | 0 | 78 | 48 | 126 | 0 | 0 | 0 | 0 | 0 | 0 | 0 | 0 | 0 |
| 34 | Aatimakhan Darul Aaloom Faizan Muftia Azam Chaulika | 10 | 0 | 0 | 0 | 89 | 36 | 125 | 0 | 0 | 0 | 0 | 0 | 0 | 0 | 0 | 0 |
| Total | 516 | 257 | 773 | 3,036 | 1,997 | 5,033 | 243 | 176 | 419 | 75 | 16 | 91 | 0 | 0 | 0 |
5.1.3 Teachers and Educational Manpower
Table No. 66: Details of Teachers and Educational Manpower in Sub-Metropolitan City
| S.N. | School Name | Operating Grades | Primary (Darbandi) | Primary (Rahat) | Primary (Total) | Lower Sec. (Darbandi) | Lower Sec. (Rahat) | Lower Sec. (Total) | Secondary (Darbandi) | Secondary (Rahat) | Secondary (Total) | Higher Sec. (Darbandi) | Higher Sec. (Rahat) | Higher Sec. (Total) | Grand Total |
|---|---|---|---|---|---|---|---|---|---|---|---|---|---|---|---|
| 1 | Saraswati Ma.Vi. | 12 | 7 | 0 | 7 | 4 | 0 | 4 | 5 | 0 | 5 | 0 | 2 | 2 | 18 |
| 2 | Gyansagar Ma.Vi. | 10 | 8 | 0 | 8 | 3 | 1 | 4 | 2 | 2 | 4 | 0 | 0 | 0 | 16 |
| 3 | Mahendra Ma.Vi. | 12 | 6 | 1 | 7 | 4 | 0 | 4 | 5 | 0 | 5 | 2 | 1 | 3 | 19 |
| 4 | Anathalaya Gousiya Ma.Vi. | 10 | 0 | 4 | 4 | 0 | 2 | 2 | 0 | 1 | 1 | 0 | 0 | 0 | 7 |
| 5 | Adarsha Ma.Vi. | 12 | 6 | 3 | 9 | 4 | 0 | 4 | 4 | 1 | 5 | 0 | 2 | 2 | 20 |
| 6 | Yuddha Sanskriti Ma.Vi. | 10 | 3 | 0 | 3 | 3 | 1 | 4 | 5 | 0 | 5 | 0 | 0 | 0 | 12 |
| 7 | Narayan Ma.Vi. | 12 | 6 | 0 | 6 | 4 | 0 | 4 | 5 | 0 | 5 | 0 | 2 | 2 | 17 |
| 8 | Maharaja Ma.Vi. | 12 | 7 | 1 | 8 | 4 | 0 | 4 | 5 | 0 | 5 | 0 | 0 | 0 | 17 |
| 9 | Shree Devtadin Ma.Vi. | 10 | 7 | 2 | 9 | 4 | 0 | 4 | 0 | 0 | 0 | 0 | 0 | 0 | 13 |
| 10 | Jaya Janata Ma.Vi. | 12 | 4 | 4 | 8 | 0 | 4 | 4 | 1 | 1 | 2 | 0 | 1 | 1 | 15 |
| 11 | Mangal Prasad Ma.Vi. | 12 | 7 | 2 | 9 | 4 | 0 | 4 | 4 | 1 | 5 | 4 | 0 | 4 | 22 |
| 12 | Ma.Vi. Mahendranagar | 10 | 5 | 1 | 6 | 3 | 0 | 3 | 1 | 2 | 3 | 0 | 0 | 0 | 12 |
| 13 | Jagat Jyoti Ma.Vi. | 10 | 4 | 3 | 7 | 1 | 3 | 4 | 1 | 1 | 2 | 0 | 0 | 0 | 13 |
| 14 | Dhambojhi Ma.Vi. | 12 | 12 | 1 | 13 | 4 | 0 | 4 | 4 | 0 | 4 | 4 | 0 | 4 | 25 |
| 15 | Phulteka Ma.Vi. | 10 | 5 | 1 | 6 | 4 | 0 | 4 | 3 | 1 | 4 | 0 | 0 | 0 | 14 |
| 16 | Nepalgunj Kanya Ma.Vi | 12 | 6 | 2 | 8 | 3 | 0 | 3 | 1 | 1 | 2 | 0 | 0 | 0 | 13 |
| 17 | Sharada Aadhabhut Vi. | 8 | 5 | 0 | 5 | 3 | 0 | 3 | 0 | 0 | 0 | 0 | 0 | 0 | 8 |
| 18 | Arun Jyoti Ma.Vi. | 7 | 4 | 3 | 7 | 0 | 0 | 0 | 0 | 0 | 0 | 0 | 0 | 0 | 11 |
| 19 | Ne.Ra. Aadhabhut Natanpur | 8 | 4 | 3 | 7 | 1 | 0 | 1 | 0 | 0 | 0 | 0 | 0 | 0 | 8 |
| 20 | Aa.Vi. Jayaspur | 8 | 3 | 4 | 7 | 0 | 2 | 2 | 0 | 0 | 0 | 0 | 0 | 0 | 9 |
| 21 | Bageshwari Aadhabhut Belaspur | 8 | 7 | 0 | 7 | 0 | 0 | 0 | 0 | 0 | 0 | 0 | 0 | 0 | 7 |
| 22 | Hanuman Aa.Vi. Jamunaha | 8 | 5 | 0 | 5 | 3 | 1 | 4 | 0 | 0 | 0 | 0 | 0 | 0 | 9 |
| 23 | Ne.Ra.Pra.Vi. Suiya | 5 | 4 | 1 | 5 | 0 | 0 | 0 | 0 | 0 | 0 | 0 | 0 | 0 | 5 |
| 24 | Aadhabhut Vidyalaya Puraini | 8 | 6 | 1 | 7 | 1 | 1 | 2 | 0 | 0 | 0 | 0 | 0 | 0 | 9 |
| 25 | Ne.Ra.Ma.Vi. Gharbaritol | 9 | 7 | 0 | 7 | 2 | 0 | 2 | 0 | 0 | 0 | 0 | 0 | 0 | 9 |
| 26 | Ne.Ra.Ma.Vi. Kanthipur | 8 | 5 | 2 | 7 | 2 | 0 | 2 | 0 | 0 | 0 | 0 | 0 | 0 | 9 |
| 27 | Hanuman Pra.Vi. Gosaigaun | 5 | 4 | 1 | 5 | 0 | 0 | 0 | 0 | 0 | 0 | 0 | 0 | 0 | 5 |
| 28 | Ramjanaki Pra.Vi. Lagdahawa | 3 | 2 | 0 | 2 | 0 | 0 | 0 | 0 | 0 | 0 | 0 | 0 | 0 | 2 |
| 29 | Ramjanaki Ra.Pra.Vi. Manikapur | 3 | 1 | 1 | 2 | 0 | 0 | 0 | 0 | 0 | 0 | 0 | 0 | 0 | 2 |
| 30 | Karnababa Pra.Vi. | 5 | 2 | 2 | 4 | 0 | 0 | 0 | 0 | 0 | 0 | 0 | 0 | 0 | 4 |
| 31 | Shree Lalabhuwaneshwari Suryapur | 5 | 4 | 0 | 4 | 0 | 0 | 0 | 0 | 0 | 0 | 0 | 0 | 0 | 4 |
| 32 | Bhawani Ne.Pra.Vi. Madanapur | 3 | 3 | 0 | 3 | 0 | 0 | 0 | 0 | 0 | 0 | 0 | 0 | 0 | 3 |
| 33 | Saraswati Pra.Vi. Nepalgunj | 3 | 2 | 2 | 4 | 0 | 0 | 0 | 0 | 0 | 0 | 0 | 0 | 0 | 4 |
| 34 | Ne.Ra.Pra.Vi. Kalbapurwa | 5 | 5 | 0 | 5 | 0 | 0 | 0 | 0 | 0 | 0 | 0 | 0 | 0 | 5 |
| 35 | Balmandir Pra.Vi. Nepalgunj | 5 | 4 | 0 | 4 | 0 | 0 | 0 | 0 | 0 | 0 | 0 | 0 | 0 | 4 |
| 36 | Karagar Pra.Vi. Nepalgunj | 5 | 1 | 0 | 1 | 0 | 0 | 0 | 0 | 0 | 0 | 0 | 0 | 0 | 1 |
| 37 | Balmiki Pra.Vi. Koriyanpur | 3 | 3 | 0 | 3 | 0 | 0 | 0 | 0 | 0 | 0 | 0 | 0 | 0 | 3 |
| 38 | Pateshwari Aa.Vi. Bhujangaun | 8 | 4 | 1 | 5 | 0 | 0 | 0 | 0 | 0 | 0 | 0 | 0 | 0 | 5 |
| 39 | Ne.Ra.Pra.Vi. Sangamnagar | 5 | 1 | 2 | 3 | 0 | 0 | 0 | 0 | 0 | 0 | 0 | 0 | 0 | 3 |
| 40 | Ne.Ra.Pra.Vi. Fingariyanpurwa | 5 | 2 | 3 | 5 | 0 | 0 | 0 | 0 | 0 | 0 | 0 | 0 | 0 | 5 |
| 41 | Ne.Ra.Pra.Vi. Jangalisinhapurwa | 5 | 3 | 1 | 4 | 0 | 0 | 0 | 0 | 0 | 0 | 0 | 0 | 0 | 4 |
| 42 | Ne.Ra.Pra.Vi. Bageshwaritol | 3 | 3 | 0 | 3 | 0 | 0 | 0 | 0 | 0 | 0 | 0 | 0 | 0 | 3 |
| Total | 187 | 52 | 239 | 61 | 15 | 76 | 46 | 11 | 57 | 10 | 8 | 18 | 390 |
Table No. 67: Details of Religious School Teacher Grant Quota in Sub-Metropolitan City
| S.N. | School Name | Primary (Darbandi) | Primary (Rahat) | Primary (Total) |
|---|---|---|---|---|
| 1 | Jamia Kadariya Jiyaun Karan | 0 | 1 | 1 |
| 2 | Madrasa Gajiya Anwarul Alum | 0 | 1 | 1 |
| 3 | Aidara Miswahiya Gulshane Danish | 0 | 3 | 3 |
| 4 | Madrasa Masyudiya Aale Mustafa | 0 | 1 | 1 |
| 5 | Jamia Mainiya Badarul Uloom | 0 | 2 | 2 |
| 6 | Aljayitul Islamia Razaul Uloom | 0 | 1 | 1 |
| 7 | Jamia Islamia Razae Mustafa | 0 | 2 | 2 |
| 8 | Madrasa Arbiya Jamiul Hasnat | 0 | 1 | 1 |
| 9 | Darul Uloom Moinia Faizane Gaji | 0 | 1 | 1 |
| 10 | Aaisa Madrasa Tul Wanat | 0 | 5 | 5 |
| 11 | Madrasa Darul Uloom Faizul Rasul | 0 | 1 | 1 |
| 12 | Madrasa Darul Uloom Garib Nawaz | 0 | 1 | 1 |
| 13 | Madrasa Gulshane Gaji | 0 | 1 | 1 |
| 14 | Barkatiya Ma.Vi. | 0 | 3 | 3 |
| 15 | Madrasa Miswahiya Chistiya | 0 | 1 | 1 |
| Total | 0 | 25 | 25 |
5.1.4 Schools with ICT Lab
| S.N. | School Name | Address |
|---|---|---|
| 1. | Shree Phulteka Ma.Vi. | Nepalgunj-6 |
| 2. | Shree Anathalaya Ma.Vi. | Nepalgunj-4 |
| 3. | Shree Jaya Janata Ma.Vi. | Nepalgunj-20, Dhapuwa |
5.1.5 Schools with Library Facilities
| School Name | Address | Number |
|---|---|---|
| Shree Mangalprasad Ma.Vi. (Model School) | Nepalgunj-8 | 1 |
| Shree Pateshwari Aa.Vi. (Library) | Nepalgunj-18 Bhujingaun | 1 |
5.1.6 Educational Quality Details
School Support Mechanism
Exam Management
Teachers Capacity Development Training
Regular Monitoring and Supervision
Act, Regulation and Procedure Formulation
5.1.7 Child-Friendly Education Details
Currently, efforts made by Nepalgunj Sub-Metropolitan City regarding child-friendly education are as follows:
Punishment-free Education
Arrangement of Play Materials in Child Development
Arrangement of Capacity Development Training
Arrangement of Child-Friendly Drinking Water and Toilets
Formation of Child Clubs
Operation of Programs Related to Child Education
5.2 Health and Nutrition
5.2.1 Health Institutions Details
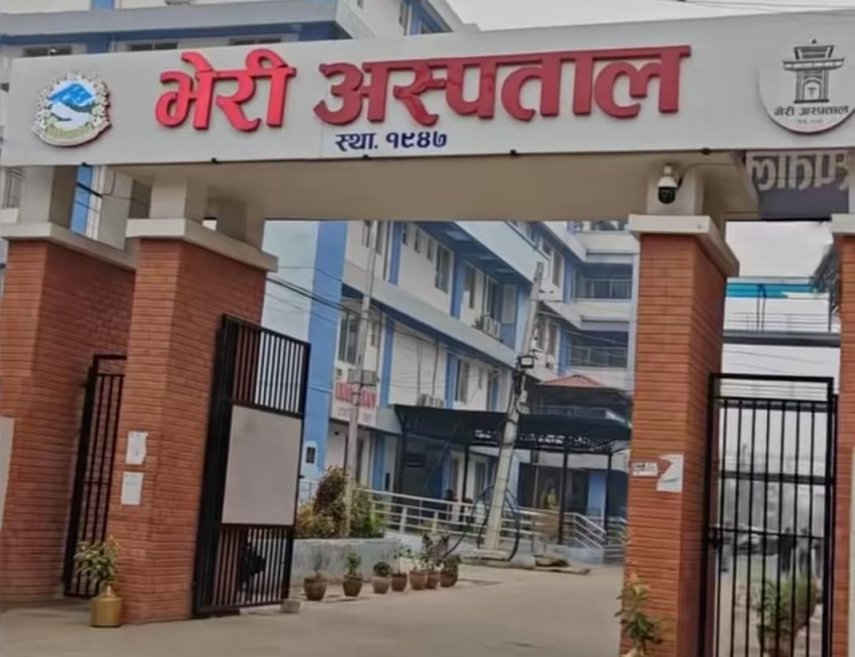
Bheri Hospital
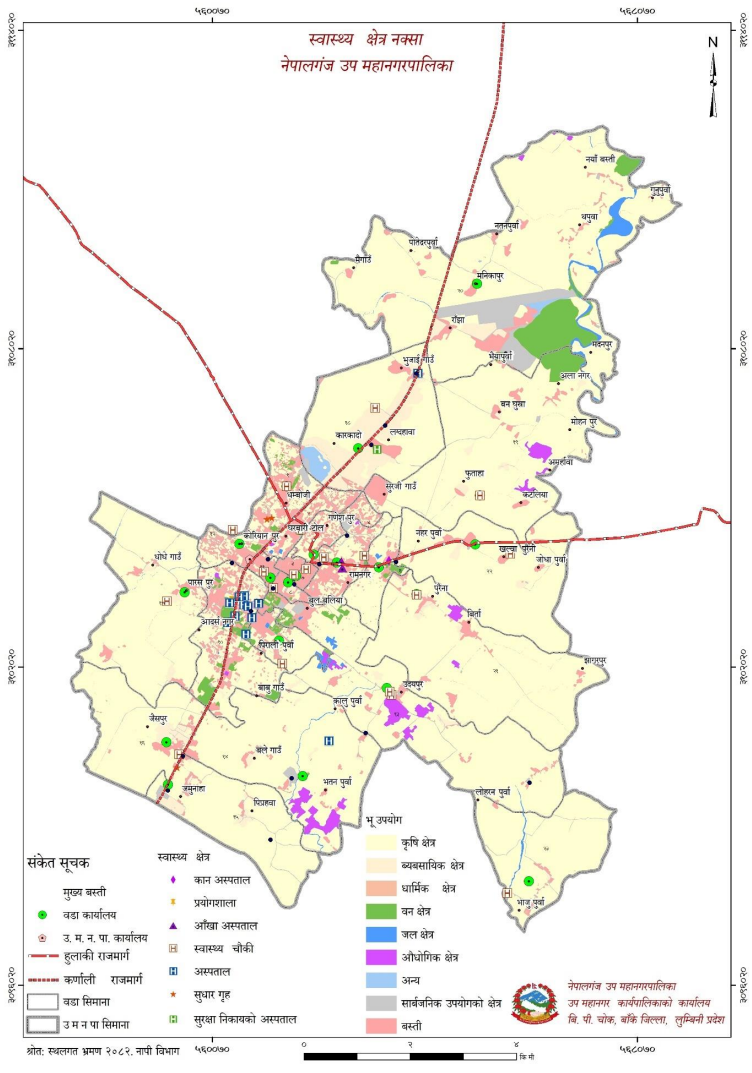
Map No. 8: Health Map of Sub-Metropolitan City
Article 35 of the Constitution of Nepal has established the right relating to health as a fundamental right. Sub-article 1 mentions that every citizen shall have the right to free basic health services from the State, and no one shall be deprived of emergency health services. As it is the responsibility of the local government to implement this right, it is essential to manage basic health infrastructure and services in the Sub-Metropolitan City.
Due to the accessible geographical condition of this Sub-Metropolitan City, the condition of essential physical and social infrastructure is good. Education, health, poverty, and other indicators appear relatively stronger compared to other local levels of the country. Currently, health services are being provided in the Sub-Metropolitan City through the private sector including Bheri Hospital, Nepalgunj Medical College, along with 12 Urban Health Centers and 11 Health Posts under the Nepalgunj Sub-Metropolitan City. Natural naturopathy centers and Ayurveda centers are also in operation from the private sector.
Table No. 68: Details of Health Institutions in the Sub-Metropolitan City
| S.N. | Details of Health Institution | Address |
|---|---|---|
| 1. | Urban Health Service Center | Ward No. 1 |
| 2. | Urban Health Service Center | Ward No. 2 |
| 3. | Urban Health Service Center | Ward No. 3 |
| 4. | Urban Health Service Center | Ward No. 4 |
| 5. | Urban Health Service Center | Ward No. 5 |
| 6. | Urban Health Service Center | Ward No. 6 |
| 7. | Urban Health Service Center | Ward No. 7 |
| 8. | Urban Health Service Center | Ward No. 8 |
| 9. | Urban Health Service Center | Ward No. 9 |
| 10. | Urban Health Service Center | Ward No. 10 |
| 11. | Urban Health Service Center | Ward No. 11 |
| 12. | Nepalgunj Health Post | Ward No. 12 |
| 13. | Udayapur Health Post | Ward No. 13 |
| 14. | Bhawaniyapur Health Post | Ward No. 14 |
| 15. | Piprahwa Health Post | Ward No. 15 |
| 16. | Jayaspur Health Post | Ward No. 16 |
| 17. | Paraspur Health Post | Ward No. 17 |
| 18. | Khaskarkando Health Post | Ward No. 18 |
| 19. | Basudevpur Health Post | Ward No. 19 |
| 20. | Manikapur Health Post | Ward No. 20 |
| 21. | Puraina Health Post | Ward No. 21 |
| 22. | Puraini Health Post | Ward No. 22 |
| 23. | Urban Health Service Center | Ward No. 23 |
| 24. | Bheri Hospital | |
| 25. | Specialist Children's Hospital Nepalgunj | |
| 26. | Sanjivani Diagnosis Center Nepalgunj | |
| 27. | Western Hospital Nepalgunj | |
| 28. | Nepalgunj Medical College Nepalgunj | |
| 29. | Kanti Arogya Hospital Nepalgunj | |
| 30. | Nepal Health Campus | |
| 31. | I.N.F. Hospital Manpur | |
| 32. | Sungabha Health | |
| 33. | Everest Health Care |
5.2.2 Immunization and Safe Motherhood
A) Details of Immunization
Children are the builders of the future. For this, it is necessary for them to be healthy and disease-free. In childhood, they must be given BCG once, DPT three times, Measles once, Polio, and Vitamins in prescribed doses. All five vaccines should be given to children regularly and in full doses. The Government of Nepal has placed the National Immunization Program as a high priority. The immunization program is an effective and economical effort in the health sector. The immunization program has significantly helped to reduce the child mortality rate and prevent various diseases. This has helped to achieve the Sustainable Development Goal's target of reducing child mortality (MDG-4).
Table No. 69: Details regarding Immunization
| S.N. | Indicators | Shrawan 2079 / Asar 80 | Shrawan 2080 / Asar 81 | Shrawan 2081 / Asar 82 |
|---|---|---|---|---|
| 1 | Overall monthly reporting rate of Sub-Metropolitan City (%) | 100 | 100 | 100 |
| 2 | Overall monthly reporting rate on time of Sub-Metropolitan City (%) | 90.18 | 91.95 | 83.33 |
| 3 | % of children receiving full immunization as per national immunization schedule | 82.93 | 101.32 | 106.79 |
| 4 | % of children taking BCG vaccination under 1 year | 170.65 | 166.93 | 153.02 |
| 5 | % of children taking DPT first vaccination under 1 year | 123.42 | 121.71 | 112.71 |
| 6 | % of children taking DPT third vaccination under 1 year | 115.15 | 116.03 | 106.34 |
| 7 | % of children under 1 year receiving first dose of Measles-Rubella vaccine | 110.91 | 110.89 | 103.94 |
| 8 | % of children between 12 to 23 months receiving second dose of Measles-Rubella vaccine | 109.22 | 104.5 | 111.85 |
| 9 | % of pregnant women receiving TD2 & TD2+ vaccination | 99.8 | 99.47 | 91.07 |
| 10 | % of children taking PCV first vaccination under 1 year | 124.48 | 121.71 | 112.4 |
| 11 | % of children taking PCV third vaccination under 1 year | 112.89 | 110.86 | 104.13 |
| 12 | Penta 1 Vs Measles 2 Drop out rate | 11.19 | 15.62 | 4.9 |
| 13 | Penta 1 Vs Penta 3 Drop out rate | 6.7 | 4.67 | 5.65 |
| 14 | PCV Drop out rate | 9.31 | 8.92 | 7.36 |
| 15 | Measles vaccine Drop out rate | 15.07 | 17.17 | 16.96 |
| 16 | Measles vaccine wastage rate | 38.1 | 41.19 | 37.05 |
| 17 | TD vaccine wastage rate | 23.74 | 25.08 | 27.36 |
| 18 | % of low weight children among those whose growth was monitored (0-23 months) | 75.22 | 67.54 | 58.84 |
| 19 | % of infants with low birth weight (2.5kg) in health institutions | 14.41 | 14.13 | 15.07 |
| 20 | Average growth monitoring times for children 0-23 months | 4.46 | 5.89 | 5.62 |
| 21 | % of PSBI among registered sick patients under 2 months | 7.25 | 5.03 | 0.54 |
| 22 | % of children with PSBI receiving first dose of Gentamicin | 80 | 100 | 100 |
| 23 | % of children with PSBI receiving full dose of Gentamicin | 40 | 100 | 50 |
| 24 | Incidence rate of diarrhea among children under five years (per thousand) | 399.89 | 736.14 | 554.26 |
| 25 | Incidence rate of acute respiratory infection (ARI) among children under five years (per thousand) | 506.52 | 773.11 | 736.75 |
| 26 | Incidence rate of pneumonia among children under five years (per thousand) | 84.62 | 99.39 | 68.93 |
| 27 | Incidence rate of pneumonia among children under five years suffering from ARI (per thousand) | 100.87 | 100 | 100 |
| 28 | Percentage of infants aged 2 to 59 months with pneumonia treated with Antibiotics (Amoxicillin) | 375 | 117.32 | 233.33 |
| 29 | % of women undergoing pregnancy check-up at least once in health institutions | 156.82 | 152.18 | 132.16 |
| 30 | % of women undergoing first pregnancy check-up as per protocol in health institutions | 59.1 | 53.66 | 53.44 |
| 31 | % of women undergoing pregnancy check-up four times as per protocol in health institutions | 66.17 | 51.15 | 65.48 |
| 32 | % of women receiving 180 Iron tablets during pregnancy | 66.03 | 51.73 | 59.41 |
| 33 | % of women receiving Calcium tablets during pregnancy | 4.73 | 11.3 | 19.08 |
| 34 | % of women undergoing pregnancy check-up eight times as per protocol in health institutions | 13.36 | 26.93 | 29.57 |
| 35 | Institutional delivery % | 333.57 | 321.99 | 282.46 |
| 36 | Delivery % under 20 years | 6.13 | 5.92 | 5.82 |
| 37 | % of postpartum women receiving Iron tablets for 45 days | 16.51 | 102.27 | 101.87 |
| 38 | Number of postpartum women receiving Iron tablets for 45 days | 1528 | 9628 | 8813 |
| 39 | Number of postpartum women receiving Vitamin A | 6956 | 9616 | 8704 |
| 40 | Total Malaria positive cases | 10 | 12 | 40 |
| 41 | Leprosy prevalence rate per 10,000 population | 6.74 | 12.03 | 11.88 |
| 42 | Leprosy new case detection rate (per 10,000) | 0.7 | 1.17 | 0.82 |
| 43 | Number of new leprosy patients | 12 | 20 | 14 |
| 44 | Case notification rate (CNR) for all types of TB cases | 189.33 | 183.64 | 174.07 |
| 45 | Tuberculosis treatment success rate | 91.84 | 88.81 | 88.63 |
| 46 | Number of newly registered tuberculosis patients | 303 | 287 | 281 |
| 47 | Number of registered relapse tuberculosis patients | 23 | 26 | 18 |
Vaccines against deadly diseases that can be contracted in childhood and later in life such as Tuberculosis, Diphtheria, Whooping Cough, Tetanus, Hepatitis B, Influenza type B, Polio, Pneumonia, Measles, Rubella and Japanese Encephalitis must be compulsorily administered in a phased manner on time. These vaccines are BCG, DPT, OPV, PCV, IPV, MR, JE / ID respectively. Thus, if vaccines are administered on time, it becomes an effective measure to control child mortality by being free from the risk of major diseases with limited investment.
B) Safe Motherhood Status Details
If children are not cared for and looked after from the time they are in the womb and after birth, they are at risk of being infected with various diseases. While in the womb, the child's health basically depends on the mother's age, nutrition, rest, intake of intoxicating and tobacco substances, etc. For a child to be born healthy, a pregnant woman must have regular health check-ups at least four times and must take the necessary vaccines (T.T.) and iron, vitamin tablets regularly. Since getting pregnant at a young age harms the health of both the mother and the baby, the government has legally set the minimum age for marriage at 20 years. However, 17 percent of teenage girls get pregnant or become mothers between the ages of 15 to 19 (Nepal Demographic and Health Survey, 2011). The government has been consistently conducting community-based programs for safe motherhood and newborn health through the Department of Health Services.
Table No. 70: Details of Safe Motherhood Status
| S.N. | Indicators | Shrawan 2078 to Asar 79 | Shrawan 2079 to Asar 80 | Shrawan 2080 to Chaitra End 81 |
|---|---|---|---|---|
| 1 | Number of women getting pregnancy check-ups 4 times as per protocol | 63 | 66 | 59 |
| 2 | Number of women getting pregnancy check-ups 8 times as per protocol | 0 | 13 | 27 |
| 3 | Total number of live birth newborns at home | 111 | 16 | 41 |
| 4 | Number of institutional deliveries | 320 | 334 | 322 |
| 5 | Delivery rate by Skilled Birth Attendant (SBA) | 315 | 77 | 69 |
| 6 | Delivery rate by Skilled Health Personnel (SHP) | 5 | 257 | 253 |
| 7 | Number of women getting pregnancy check-ups 3 times as per protocol | 88 | 44 | 40 |
| 8 | Total number of maternal deaths | 16 | 13 | 9 |
| 9 | Number of newborn deaths | 157 | 94 | 89 |
| Total | 1075 | 914 | 909 |
5.2.3 Child Health and Malnutrition
The state of nutrition of any place can be easily estimated by looking at the children of that place. Nourished children can be seen as an indicator of the social and economic development of any place. The government has prioritized nutrition and has been regularly monitoring the child growth of children under 5 years. The Convention on the Rights of the Child, 1989 also mentions that children should be protected from neglect, abandonment, negligence, abuse, and violence, and their right to food and nutrition should be ensured. The Constitution of Nepal (2072) has also placed food sovereignty as a fundamental right. Since health and nutrition are the first important needs of human life and without healthy citizens, other development activities of the nation cannot be effective, public health study becomes an important part of the planning process. In this Sub-Metropolitan City, while effectively monitoring the child nutrition allowance provided by the Government of Nepal based on national policy and programs to bring improvement in nutrition, arrangements have been made to improve the nutrition of children, along with running programs like the Multi-Sectoral Nutrition Plan taking lessons from the past to bring effective improvements in nutrition. Apart from this, national and international organizations are also working to carry out health and nutrition-related works.
Table No. 71: State of Child Health and Malnutrition
| S.N. | Indicators | Unit | Shrawan 2078 to Asar 79 | Shrawan 2079 to Asar 80 | Shrawan 2080 to Falgun End 81 |
|---|---|---|---|---|---|
| 1 | Low birth weight newborns | Percent | 4.2 | 3.7 | 1.5 |
| 2 | Average times weight taken of children completing 23 months in percentage | Percent | 70.8 | 75.2 | 67.5 |
| 3 | Babies breastfed for up to 6 months after birth | Percent | 37.5 | 41.2 | 68.2 |
| 4 | Number of pregnant women taking 180 Iron | Percent | 65 | 66 | 51.7 |
| 5 | Women receiving Vitamin A during postpartum stage | Percent | 74 | 75.2 | 102.1 |
| 6 | Average visits of under 2 years infants for growth monitoring | Percent | 3 | 3.7 | 4.1 |
| 7 | Number of severely malnourished children | Number | 0 | 121 | 140 |
| 8 | Severely malnourished children cured | Percent | 0 | 14.1 | 14.4 |
| 9 | % of children aged 6-23 months receiving 3 cycles (180 pieces) of Baalvita | Percent | 0 | 2.5 | 9.1 |
| Total | 250.3 | 486.9 | 537.1 |
5.2.4 Major Diseases and Treatment Details
According to the number of patients registered in the OPD of health institutions under this Sub-Metropolitan City, the details of the top 10 health problems seen recently are mentioned in the table below.
Table No. 72: Details of top 10 health problems
| S.N. | Indicators | Shrawan 2079 / Asar 80 | Shrawan 2080 / Asar 81 | Shrawan 2081 / Asar 82 |
|---|---|---|---|---|
| 1 | Eye problem (Cataract patients) | 18898 | 19914 | 19535 |
| 2 | Eye problem (Refractive patients) | 15819 | 17891 | 36319 |
| 3 | Eye problem (Conjunctivitis patients) | 14891 | 37654 | 12161 |
| 4 | Outpatient disease - ENT Infection - Chronic Suppurative Otitis Media patients | 10138 | 12088 | 12874 |
| 5 | Outpatient disease - Other infectious diseases - Upper Respiratory Tract Infection (URTI) patients | 9217 | 7813 | 7937 |
| 6 | OPD disease - Orthopedic - Fracture | 8749 | 8301 | 304 |
| 7 | Outpatient disease - Skin disease - Fungal infection (Lichen planus) patients | 8150 | 5622 | 4224 |
| 8 | OPD Morbidity - Other diseases and injuries - Headache | 6054 | 4414 | 4157 |
| 9 | Outpatient disease - Other Infectious diseases - ARI / Lower Respiratory Tract Infection (LRTI) patients | 5157 | 3318 | 3290 |
| 10 | OPD disease - General symptoms - Fever | 4618 | 5749 | 4146 |
5.2.5 Safe Motherhood
A) Family Planning
From studies done by various organizations indicating benefits of family planning, it has been proven that it plays a significant role in improving the health of mothers, children, and newborns. In addition, it helps to promote gender equality, women's education, and growth development. Therefore, with the aim of providing quality family planning services, the reproductive health program and family planning program have been expanded since 1991 to hospitals, health posts, primary health centers, and urban clinics, providing services through female health volunteers. Currently, the details of users of family planning devices within the Sub-Metropolitan City are included in the table below.
Table No. 73: Details of Family Planning Users
| S.N. | Indicators | Shrawan 2079 / Asar 80 | Shrawan 2080 / Asar 81 | Shrawan 2081 / Asar 82 |
|---|---|---|---|---|
| 1 | Number of continuous users of Pills | 1465 | 1526 | 771 |
| 2 | Number of continuous users of Depo | 1972 | 2001 | 1944 |
| 3 | Number of continuous users of IUCD | 997 | 1070 | 1102 |
| 4 | Number of continuous users of Implant | 1888 | 2077 | 2229 |
| Total | 6322 | 6674 | 6046 |
B) Details of born, living and died children based on sex of child and mother's age group
Table No. 74: Details of born, living and died children based on sex of child and mother's age group
| Sex/Status | 15-19 years | 20-24 years | 25-29 years | 30-34 years | 35-39 years | 40-44 years | 45-49 years | Total |
|---|---|---|---|---|---|---|---|---|
| Total born children number | ||||||||
| Boys | 203 | 2565 | 5832 | 7459 | 8810 | 7496 | 6168 | 38533 |
| Girls | 174 | 2263 | 5261 | 6999 | 7833 | 6389 | 5185 | 34104 |
| Total | 377 | 4828 | 11093 | 14458 | 16643 | 13885 | 11353 | 72637 |
| Children currently alive | ||||||||
| Boys | 199 | 2497 | 5702 | 7292 | 8587 | 7282 | 5952 | 37511 |
| Girls | 171 | 2207 | 5166 | 6845 | 7621 | 6223 | 4986 | 33219 |
| Total | 370 | 4704 | 10868 | 14137 | 16208 | 13505 | 10938 | 70730 |
| Deceased children | ||||||||
| Boys | 4 | 68 | 130 | 167 | 223 | 214 | 216 | 1022 |
| Girls | 3 | 56 | 95 | 154 | 212 | 166 | 199 | 885 |
| Total | 7 | 124 | 225 | 321 | 435 | 380 | 415 | 1907 |
Out of the total 72,637 children born alive in the last 12 months by women in the 15 to 49 age group in the Sub-Metropolitan City, 70,730 children are currently alive. Similarly, the number of children who died during the same period is 1,907, the detailed breakdown of which by sex is presented in the table.
C) Details of women's age at first childbirth
From legal and reproductive health perspectives, becoming a mother at the age of 20 or under is considered illegal and risky for the health of both mother and child. On one hand, physical, mental, and financially immature conception and childbirth carry a high risk of giving birth to an immature, low birth weight, physically and intellectually handicapped child, while on the hand, without adequate knowledge about antenatal care, maternal and child care, nutrition, and hygiene, there is a possibility that mother and child may fall victim to various types of infections. Nepal has achieved significant progress in the field of maternal and child health between the Millennium Development Goals 2000-2015. Taking 1990 as the base year, 108 out of every 1000 live births died in Nepal, and this number has substantially declined to 33 by 2015, while the under-5 child mortality rate (per thousand) has dropped to 38. Similarly, considering 1990 as the base year, maternal mortality (per hundred thousand) was 850, which appears to have dropped to 258 by 2015, while data shows the proportion of women receiving deliveries from trained health workers reached 55.6 percent. Overall, signs of positive impact in the area of maternal and child health are appearing in the municipality.
Table No. 75: Female population according to the number of children currently born alive by married women in the 15-49 age group
| Currently alive children | 15-19 years | 20-24 years | 25-29 years | 30-34 years | 35-39 years | 40-44 years | 45-49 years | Total married women |
|---|---|---|---|---|---|---|---|---|
| No child | 588 | 1724 | 1116 | 520 | 325 | 286 | 267 | 4806 |
| 1 child | 215 | 1968 | 2036 | 1361 | 834 | 488 | 375 | 7277 |
| 2 children | 60 | 919 | 2103 | 2337 | 2199 | 1643 | 1041 | 10302 |
| 3 children | 10 | 257 | 984 | 1342 | 1466 | 1130 | 883 | 6072 |
| 4 children | 3 | 52 | 335 | 628 | 826 | 692 | 548 | 3084 |
| 5 children | 0 | 5 | 87 | 212 | 389 | 393 | 341 | 1427 |
| 6 children | 0 | 3 | 16 | 90 | 174 | 185 | 185 | 652 |
| 7 children | 0 | 0 | 4 | 36 | 57 | 69 | 98 | 264 |
| 8 children | 0 | 0 | 0 | 3 | 35 | 34 | 46 | 118 |
| More than 9 children | 0 | 0 | 0 | 1 | 4 | 14 | 19 | 38 |
| Total | 876 | 4928 | 6681 | 6530 | 6309 | 4913 | 3803 | 34040 |
| Percentage | 2.57 | 14.48 | 19.63 | 19.18 | 18.53 | 14.43 | 11.17 | 100 |
Out of a total of 34,040 in the Sub-Metropolitan City, 876 women, i.e., 2.57 percent, appeared to have given birth to their first child between the ages of 15-19. Similarly, 4,928 or 14.48 percent of women became mothers at 20-24 years of age, 6,681 or 19.63 percent at 25-29 years, and 6,530 or 19.18 percent at 30-34 years of age, while the number of women becoming mothers for the first time above 35-39 years is 6,309, which is 18.53 percent. In the exact same way, there are 4,913 women or 14.43 percent for 40-44 years, and 3,803 or 11.17 percent of women aged 45-49 have given birth to their first child.
5.2.6 Married and Unmarried Women and Men Details
Table No. 76: Details of Married and Unmarried Women and Men
| S.N. | Details of Men and Women | Number of Men | Number of Women | Total | Percentage |
|---|---|---|---|---|---|
| 1. | Unmarried | 27,827 | 21,997 | 49,824 | 37.2 |
| 2. | Married | 37,222 | 40,666 | 77,888 | 58.2 |
| 3. | Single (Widower/Widow) | 1,259 | 4,137 | 5,396 | 4.0 |
| 4. | Divorced | 87 | 161 | 248 | 0.2 |
| 5. | Separated | 152 | 259 | 401 | 0.3 |
| Total | 66,537 | 67,220 | 1,33,757 | 100 |
5.3 Drinking Water and Sanitation
5.3.1 Drinking Water Source Details
Clean water and sanitation are major factors affecting human health and Sustainable Development Goal 6 aims to ensure safe drinking water and sanitation. Furthermore, the Constitution of Nepal has recognized drinking water and sanitation as fundamental rights of citizens. Therefore, to contribute towards producing healthy citizens, high priority should be given to constructing additional drinking water projects and scientific methods should be used for solid waste management.
Table No. 77: Details of households based on main source of drinking water
| Ward No. | Pipe tap (inside premises) | Pipe tap (outside premises) | Tube well/Hand pump | Covered well/kuwa | Uncovered open well/kuwa | Spring water tap | River/Stream | Jar/Bottle | Other | Total |
|---|---|---|---|---|---|---|---|---|---|---|
| 1 | 741 | 136 | 475 | 3 | 21 | 156 | 1 | 622 | 12 | 2167 |
| 2 | 334 | 228 | 288 | 1 | 0 | 1 | 0 | 465 | 46 | 1363 |
| 3 | 379 | 63 | 55 | 0 | 2 | 0 | 0 | 55 | 2 | 556 |
| 4 | 458 | 186 | 665 | 10 | 19 | 64 | 2 | 1387 | 127 | 2918 |
| 5 | 208 | 46 | 663 | 1 | 10 | 2 | 1 | 200 | 6 | 1137 |
| 6 | 238 | 8 | 767 | 0 | 2 | 2 | 0 | 385 | 9 | 1411 |
| 7 | 214 | 40 | 213 | 0 | 0 | 0 | 0 | 107 | 24 | 598 |
| 8 | 605 | 31 | 141 | 0 | 1 | 0 | 0 | 65 | 1 | 844 |
| 9 | 552 | 20 | 545 | 1 | 3 | 0 | 0 | 301 | 5 | 1427 |
| 10 | 517 | 141 | 1321 | 3 | 8 | 3 | 0 | 595 | 63 | 2651 |
| 11 | 696 | 242 | 36 | 0 | 1 | 2 | 0 | 22 | 2 | 1001 |
| 12 | 372 | 102 | 704 | 2 | 1 | 0 | 0 | 521 | 25 | 1727 |
| 13 | 743 | 220 | 378 | 0 | 4 | 10 | 0 | 110 | 1 | 1466 |
| 14 | 775 | 34 | 234 | 0 | 2 | 0 | 0 | 9 | 2 | 1056 |
| 15 | 353 | 32 | 321 | 2 | 1 | 376 | 0 | 4 | 45 | 1134 |
| 16 | 221 | 52 | 806 | 1 | 3 | 0 | 0 | 7 | 10 | 1100 |
| 17 | 844 | 81 | 166 | 0 | 2 | 68 | 0 | 43 | 8 | 1212 |
| 18 | 975 | 126 | 374 | 4 | 15 | 65 | 5 | 956 | 182 | 2702 |
| 19 | 642 | 556 | 369 | 7 | 1 | 0 | 0 | 136 | 0 | 1711 |
| 20 | 1243 | 401 | 1039 | 2 | 13 | 95 | 0 | 476 | 25 | 3294 |
| 21 | 771 | 313 | 446 | 1 | 3 | 0 | 0 | 11 | 8 | 1553 |
| 22 | 180 | 27 | 718 | 0 | 5 | 0 | 0 | 58 | 78 | 1066 |
| 23 | 36 | 5 | 294 | 0 | 0 | 0 | 0 | 0 | 0 | 335 |
| Total | 12091 | 3106 | 11112 | 38 | 125 | 844 | 9 | 6551 | 689 | 34565 |
| Percentage | 34.98 | 8.99 | 32.15 | 0.11 | 0.36 | 2.44 | 0.03 | 18.95 | 1.99 | 100 |
Out of 34,565 households residing in this Sub-Metropolitan City, generally the most number of families drink water from Pipe tap (inside premises) which is 12,091 or 34.98 percent. Similarly, the number of families drinking water from Pipe tap (outside premises) is 3,106 or 8.99 percent. Generally, 11,112 households or 32.15 percent drink water from Tube well/Hand pump. In addition, there are 6,551 or 18.95 percent households using Jar/bottles. Likewise, the number of households drinking spring tap water is 844 or 2.44 percent, river/stream water is 9 or 0.03 percent, those drinking water from uncovered open wells is 125 or 0.36 percent, while those drinking from covered wells is 38 or 0.11 percent, and families using other water sources is 689 or 1.99 percent. Its detailed breakdown by ward is presented in the table.
Details of households based on main source of drinking water
Tap bars or slices to view details
According to Sustainable Development Goals Status & Roadmap: 2016-2030 (SDG-6), taking 2015 as the base year, only 15 percent of the population is seen consuming safe drinking water. According to this document, which also includes the sustainable development goal monitoring framework, this population is expected to increase gradually. Accordingly, an ambitious target has been set to reach 35 percent in 2019, 50 percent in 2022, 65 percent in 2025, and 90 percent of the total population consuming safe drinking water by 2030. To support achieving the national target and to improve the public health of the general public, there is a need to spread widespread public awareness about checking the suitability of water and safety measures while using water.
5.3.2 Toilet Usage Status
Even now, in some remote town settlements, people defecate in water sources and open places. For a civilized society, this practice is a symbol of incivility. Defecation in open areas leads to the entry of germs into the human body through food, water, and respiration. Therefore, the construction of a toilet in every household is a mandatory requirement. Currently, the government and various non-governmental organizations are seen to have given priority to toilet construction. Private houses and public places must have mandatory toilets along with handwashing water. In case poor community families cannot construct toilets themselves, the government, especially the local government, should provide subsidies for toilet construction.
Table No. 78: Details of households based on the type of toilet used by the family
| Ward No. | Flush system (Public sewerage) | Flush system (Septic tank) | Pit toilet | Community toilet | No toilet | Total |
|---|---|---|---|---|---|---|
| 1 | 28 | 1900 | 225 | 1 | 13 | 2167 |
| 2 | 17 | 1142 | 197 | 4 | 3 | 1363 |
| 3 | 83 | 408 | 59 | 3 | 3 | 556 |
| 4 | 70 | 2679 | 119 | 13 | 37 | 2918 |
| 5 | 34 | 702 | 387 | 5 | 9 | 1137 |
| 6 | 39 | 881 | 469 | 1 | 21 | 1411 |
| 7 | 7 | 478 | 188 | 2 | 7 | 682 |
| 8 | 68 | 695 | 47 | 13 | 29 | 852 |
| 9 | 80 | 1235 | 102 | 5 | 3 | 1425 |
| 10 | 90 | 2411 | 134 | 4 | 24 | 2663 |
| 11 | 38 | 876 | 52 | 9 | 26 | 1001 |
| 12 | 13 | 1329 | 373 | 4 | 19 | 1738 |
| 13 | 67 | 633 | 486 | 20 | 260 | 1466 |
| 14 | 14 | 289 | 442 | 4 | 307 | 1056 |
| 15 | 70 | 378 | 230 | 10 | 457 | 1145 |
| 16 | 9 | 483 | 489 | 5 | 114 | 1100 |
| 17 | 60 | 675 | 227 | 6 | 252 | 1220 |
| 18 | 59 | 2005 | 585 | 10 | 43 | 2702 |
| 19 | 13 | 1029 | 448 | 41 | 180 | 1711 |
| 20 | 280 | 1967 | 710 | 19 | 322 | 3298 |
| 21 | 2 | 554 | 655 | 18 | 324 | 1553 |
| 22 | 8 | 449 | 155 | 0 | 454 | 1066 |
| 23 | 1 | 128 | 35 | 0 | 171 | 335 |
| Total | 1150 | 23326 | 6814 | 197 | 3078 | 34565 |
| Percentage | 3.33 | 67.48 | 19.71 | 0.57 | 8.90 | 100 |
Out of the total households in the sub-metropolitan city, the highest 67.48 percent use Flush system (Septic tank), 3.33 percent use Flush system (Public sewerage), 19.71 percent use Pit toilet, 0.57 percent use Community toilet and 8.90 percent do not use a toilet and defecate in open places. Whose detailed breakdown by ward is mentioned in the table.
Details of households based on the type of toilet used by the family
Tap bars or slices to view details
5.3.3 Public Toilet Details
Private houses and public places must have a toilet along with handwashing water. In case poor community families cannot construct a toilet themselves, the local government should provide a subsidy for toilet construction. To make the house courtyards, roads, markets and public areas of this Sub-Metropolitan City clean, public toilets have been constructed in various places. To keep public toilets clean, the Tole Health Committee and the Sub-Metropolitan City must play an important role. By charging some fee for using the public toilet, the expenses for cleanliness and management of the toilets can be covered, and along with this, house courtyards, markets, and roads remain clean, which can also provide some contribution to the revenue of the Sub-Metropolitan City. The details of an adequate number of public toilets in this Sub-Metropolitan City are mentioned in the table.
Table No. 79: Public Toilet Details
| S.N. | Location of toilet | Ward No. |
|---|---|---|
| 1. | Inside Bageshwari Temple | 2 |
| 2. | North of Drinking Water Corporation Office | 2 |
| 3. | In front of Bheri Hospital | 10 |
| 4. | Near Meat Market | 13 |
| 5. | Near Vegetable Market | 8 |
| 6. | In front of Agricultural Development Bank | 12 |
| 7. | In front of Mini Zoo-Park | 8 |
| 8. | Salyani Bungalow | 4 |
| 9. | North of Municipality Office | 12 |
| 10. | Babugaun | 14 |
| 11. | Near Customs | 15 |
| 12. | Jayaspur (Near Highway) | 16 |
| 13. | 100 meters west from Chaulika Chowk | 17 |
| 14. | North of Hanuman Temple | 18 |
| 15. | Near Ward Office | 19 |
| 16. | Ranjha Chowk | 20 |
| 17. | Near Ward Office | 21 |
| 18. | Near Kanti Lake | 22 |
| 19. | Bhajjupuruwa | 23 |
5.3.4 Waste Management Household Details
Especially in urban areas and market centers where population density is high, the waste generated by humans, industries and factories not only disfigures the beauty of the settlement but also has a negative impact on public health. In such a situation, the waste management system must be addressed in a long-term manner by both the government and the community. Understanding that waste harms both health and beauty, proper management of waste is necessary. Organic compost can also be made from some degradable waste. Although the Sub-Metropolitan City has not systematically initiated waste management work, locals have been managing degradable and non-degradable waste in a traditional way.
Problems seen in waste management:
Currently the problems seen in this Sub-Metropolitan City are as follows:
In the name of waste management, the tendency of uncontrollably throwing waste in the lower parts of rivers and rivulets is seen everywhere. Waste thrown in this way is washed away by water during rains and taken down to the lower parts of rivers and rivulets, expanding the pollution.
Since the lower parts of the land are also water sources and the exact same water appears on the surface and seeps inside the ground, the waste thrown in the lower parts pollutes both the surface water and the groundwater.
Things to consider in solid waste management:
Separating the waste coming out of the kitchen into degradable and non-degradable.
The Sub-Metropolitan City should conduct programs to provide training for using degradables as compost and to motivate every house owner.
Re-sorting the non-degradable waste at different levels like wood, plastic, metal, glass. After identifying these wastes as per necessity, emphasizing towards related service management for those who can be reused. Managing to sort scientifically in the open spaces of this Sub-Metropolitan City area where there is no water source.
5.3.5 Drainage and Landfill Status
In city market centers and areas with integrated settlements, there must be good management of sewerage. Drainage is also a significant infrastructure of physical development. If drainage management is done along with road construction, the government is saved from double expenditure incurred in infrastructure development. In addition to this, the waste emitted from human settlements should be managed by making a landfill site at a certain distance from human settlements. A clean and clear environment without waste is a sign of civilization.
The sub-metropolitan city has not been able to properly manage drainage reasonably. However, the sub-metropolitan city is committed to moving forward by drafting an urban development plan. A specific landfill site for solid waste management couldn't be arranged in the sub-metropolitan city area.
5.3.6 Houseless Environment
According to Article 39 sub-article 9 of the Constitution of Nepal, in fundamental rights, helpless, orphan, disabled, conflict victim, displaced and at-risk children shall have the right to get special protection and facilities from the state, while Article 43 states that financially poor, incapacitated and helpless status individuals, helpless single women, persons with disabilities, children, citizens who cannot take care of themselves and citizens of endangered castes shall have the right to social security according to the law. Therefore, as a local government, the sub-metropolitan city has a mandatory obligation to protect children and other citizens who are in such a helpless situation.
5.4 Art, Language and Culture
5.4.1 Details of Local Festivals, Jatras and Fairs
People of different castes, religions, sects, and customs live in this sub-metropolitan city. While the majority of the people living here follow the Hindu religion, some people following Hindu, Christian, Islam, and Jain religions also reside here. All castes and sects have their own kind of religious culture and customs. Among them, festivals like Bada Dashain, Tihar, Ram Navami, Maha Shivaratri, Haritalika, Shree Panchami, Shree Krishna Janmashtami, Bibaha Panchami, Holi, Chaite Dashain, Saune-Maghe Sankranti, Matatirtha Aunsi, Akshaya Tritiya, Harishayani-Haribodhini Ekadashi, Nag Panchami, Rakshabandhan (Janai Purnima), Kushe Aunsi, Bala Chaturdashi, Kojagrat Purnima, Shree Swasthani Purnima, Chhath, Eid, Buddha Jayanti, Christmas Day, Bakra Eid, Asare 15, etc. are celebrated. The details regarding local festivals, jatras, and fairs celebrated in this sub-metropolitan city are mentioned in the table.
Table No. 80: Details of Local Festivals, Jatras and Fairs
| S.N. | Festival/Jatra/Fair | When it is celebrated | Celebrating Caste/Community |
|---|---|---|---|
| 1. | Dashain, Tihar, Teej, Maghi, Holi Purnima, Krishnashtami, and other festivals | Hindu | |
| 2. | Shivaratri, Saune Sankranti, Chaite Dashain | Falgun, Saun, Chait | |
| 3. | Maghe Sankranti, Teej, Krishna Janmashtami | Hindu | |
| 4. | Krishna Janmashtami | Bhadra | Hindu |
| 5. | Shivaratri Festival | Shivaratri | Hindu |
| 6. | Holi (Fagu Purnima) | Falgun | Hindu |
| 7. | Ghume (Bhumya) Festival | Hindu | |
| 8. | Christmas | Poush | Christian |
| 9. | Eid | Muslim | |
| 10. | Chhath | Kartik | Maithili |
5.5 Details of Peace and Security
As mentioned in the constitution, the state should be able to make the citizens feel secure. It is the responsibility of the state to provide civil security to the citizens of every nation. A citizen should be able to feel secure in their state. To make this efficient, civil society also plays an equally important role.
Criminal and socially unacceptable activities such as theft and robbery occurring in the sub-metropolitan city are found to be resolved through these security agencies. According to the locals, incidents of minor quarrels, beatings, boundary disputes, theft, robbery, fraud, and domestic violence occur occasionally in the Sub-Metropolitan City. Security agencies have been established in 6 places within this sub-metropolitan city, the detailed description of which is presented in the table.
Table No. 81: Details of major security agencies in the Sub-Metropolitan City
| S.N. | Name of Security Agencies | Location |
|---|---|---|
| 1. | Shree No. 4 Brigade Headquarters Imamnagar Barracks | Nepalgunj Sub-Metropolitan City Ward No. 20 Ranjha |
| 2. | Karnali Province Police Training Center Surkhet, (Currently Nepalgunj) | Nepalgunj Sub-Metropolitan City Ward No. 18 Karkando |
| 3. | Nepal Police Special Security Battalion Kohalpur, Banke (Currently Nepalgunj) | Nepalgunj Sub-Metropolitan City Ward No. 01 Nepalgunj |
| 4. | Nepal Police Province Office Karnali Province (Currently Nepalgunj) | Nepalgunj Sub-Metropolitan City Ward No. 18 Karkando |
| 5. | District Police Office, Banke. | Nepalgunj Sub-Metropolitan City Ward No. 01 Nepalgunj |
| 6. | Ward Police Office Nepalgunj, Banke | Nepalgunj Sub-Metropolitan City Ward No. 5 Banke. |
| 7. | Temporary Traffic Police Post | Nepalgunj Sub-Metropolitan City Ward No. 10 Banke. |
| 8. | Shree No. 4 Brigade Headquarters Imamnagar Barracks | Nepalgunj Sub-Metropolitan City Ward No. 20 Ranjha |
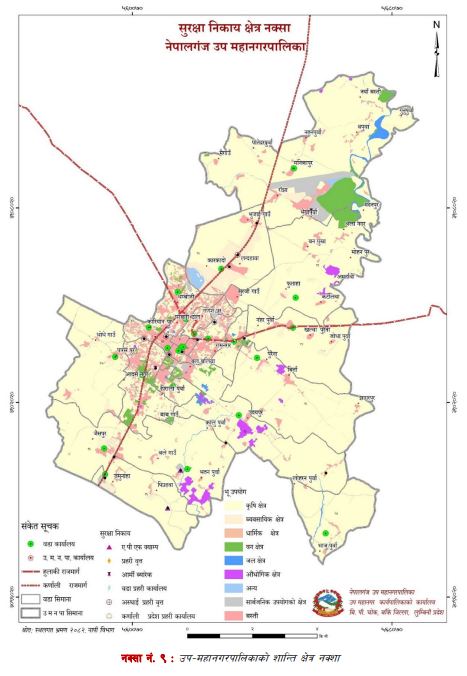
Map No. 9: Peace Area Map of Sub-Metropolitan City